Cheat Sheet
CFA 1 Formula Sheet – 2023 Syllabus
-
University:
CFA Institute -
Course:
CFA Level I - Derivatives Academic year:
2025
-
Views:
214
Pages:
23
Author:
customer-8759144
1: elastic éE.&/ é < 1: inelastic éE.&/ é = ∞: perfectly elastic TR ≥ TC TVC < TR < TC TR < TVC Short-Term Stay in Stay in Shut down Long-Term Stay in Exit market Exit market E.&/ = −1: unit elastic Income Elasticity of Demand %ΔQ&K ΔQ&K I =á à \ &] QK %ΔI ΔI where I = consumers’ income EX& > 0: normal good; EX& < 0: inferior good Cross-Price Elasticity of Demand %ΔQ&K ΔQ&K P/ E.&0 = =á à\ ] %ΔP/ ΔP/ Q&K where P/ is the price per unit of another good Y E.&0 > 0: substitutes; E.&0 < 0: complements Income and Substitution Effects Impacts of a reduction in a good’s price: Type of good Income effect Substitution effect Normal Buy more Buy more Inferior Buy less Buy more Goods with positively sloped demand curves: - Giffen goods: Negative income effect is greater than positive substitution effect if good’s price falls - Veblen goods: Demand for a status symbol good falls if its price is reduced Revenue Terms Total revenue (TR): Price times quantity; P × Q Average revenue (AR): TR⁄Q Marginal revenue (MR): ΔTR⁄ΔQ Cost Terms Total fixed cost (TFC): Sum of fixed costs Total variable cost (TVC): Sum of variable costs Total costs (TC): TFC + TVC Average fixed cost (AFC): TFC⁄Q Average variable cost (AVC): TVC⁄Q Average total cost (ATC): AFC + AFV or TC⁄Q Marginal cost (MC): ΔTC⁄ΔQ Profit Measures Accounting profit = Revenue − Accounting costs Economic costs = Accounting costs + Implicit costs Economic profit = Revenue – Economic costs = Accounting profit−Implicit costs Normal profit = Zero economic profit Profits maximized if MR = MC and MC isn’t falling www.saltsolutions.com Monopolistic Competition - Firms: Many - Products: Differentiated (via advertising) - Barriers to entry: Low - Pricing power of firms: Some Profit maximization: MR = MC Economies of Scale Each stage of expansion has its own short-run ATC curve. Minimum efficient scale is the low point on the long-run average total cost curve. E.&/ = 0: perfectly inelastic EX& = Breakeven Analysis Economic breakeven occurs if a firm’s accounting profit is enough to cover its implicit opportunity costs (i.e., normal profit). In the long run, firms cannot earn positive economic profits. THE THE FIRM FIRM AND AND MARKET MARKET STRUCTURES STRUCTURES Oligopoly - Firms: Few - Products: Similar (close substitutes) - Barriers to entry: High - Pricing power: Some or considerable Profit maximization: MR = MC Perfect Competition - Firms: Many - Products: Identical - Barriers to entry: Very low - Pricing power of firms: None Profit maximization: - P = MR = MC - P > ATC economic profit, P < ATC economic loss Kinked demand curve: A price increase will impact sales more than an equivalent price decrease Cournot assumption: Competitors will maintain current output levels if one firm changes its price Game theory: If one firm changes its prices, competitors will adjust to maximize their profits, resulting in a Nash equilibrium Price collusion is more likely to happen if: - Few firms or one dominant firm - Products are relatively similar - Firms have similar cost structures - Orders are frequent and relatively small - Credible threat of retaliation for breaking pact - The threat of external competition is high Copyright © 2021 Salt Solutions. All Rights Reserved. Personal copies permitted. Resale or distribution is prohibited. 4 Monopoly - Firm: One - Products: Unique (no close substitutes) - Barriers to entry: Very high - Pricing power of firm: Considerable (price discrimination possible) Profit maximization: MR = MC Relationship among Saving, Investment, the Fiscal Balance, and the Trade Balance (G − T) = (S − I) − (X − M) G − T = fiscal balance S − I = savings minus domestic investment X − M = trade balance Aggregate Demand (AD) The downward slope of the AD curve results from: - Wealth effect: Price level ↑, real wealth ↓, quantity demanded ↓ - Interest rate effect: Price level ↑, interest rate ↑, investment and consumption expenditures ↓ - Real exchange rate effect: Price level ↑, real exchange rate ↑, exports ↓ and imports ↑ Aggregate Supply (AS) Shifts in Aggregate Supply (SRAS and LRAS) SRAS Shift LRAS Shift Labor supply Right Right Physical capital Right Right Increase in Natural resources Human capital Productivity/Tech Nominal wages Input prices Right Right Right Left Left Price expectations Right Foreign currency values Right Business taxes Business subsidies Inflationary Gap Left Right Right Right Right None None None None None None Price discrimination by monopolists: - 1st degree: Different price for each customer - 2nd degree: Quantity-based menu options - 3rd degree: Pricing for demographic groups Market Power Measures N-firm concentration ratio: Sum of market share of the N largest firms in the industry Herfindahl-Hirschman Index (HHI): Sum of squared market share of the N largest firms AGGREGATE OUTPUT, OUTPUT,PRICES, PRICES,AND ECONOMIC AGGREGATE AND ECONOMIC GROWTH GROWTH Gross Domestic Product (GDP) Nominal GDP: GDP in terms of current prices Real GDP: GDP in terms of base-year prices GDP deflator: (Nominal GDP⁄Real GDP) × 100 GDP = C + I + G + (X − M) C = consumption I = investment G = government spending X = exports; M = imports GDI = Net domestic income + Consumption of fixed capital + Statistical discrepancy GDI = Compensation of employees + Gross operating surplus + Gross mixed income + Taxes (net of subsidies) on production + Taxes (net of subsidies) on products and imports Personal household income = Compensation of employees + Net mixed income from unincorporated businesses +Net property income www.saltsolutions.com Full employment level of output: Long-run equilibrium level of output Factors Increasing Aggregate Demand (AD) - Higher household wealth - Higher business and consumer confidence - Higher capacity utilization - Expansionary monetary and fiscal policies - Depreciating domestic currency value - Faster global economic growth Effect of Combined Changes in AS and AD Changes in AS and AD AS ↑, AD ↑ AS ↓, AD ↓ AS ↑, AD ↓ AS ↓, AD ↑ Real GDP Prices Increase Unclear Decrease Unclear Unclear Unclear Decrease Increase UNDERSTANDING BUSINESSCYCLES CYCLES UNDERSTANDING BUSINESS Business Cycle Phases Recovery - Economy: Going through a trough - Activity level: Below potential but start to increase - Employment: Layoffs slow, but firms prefer extending overtime to rehiring full-time - Inflation: Moderate - Capital spending: Low but increasing, with a focus on efficiency rather than capacity Expansion - Economy: Enjoying an upswing - Activity level: Above-average growth rates - Employment: Full-time rehiring, more overtime - Inflation: Moderate, but increasing - Capital spending: Focused on capacity expansion Copyright © 2021 Salt Solutions. All Rights Reserved. Personal copies permitted. Resale or distribution is prohibited. 5 Slowdown - Economy: Going through a peak - Activity level: Decelerating - Employment: Hiring slows - Inflation: Accelerating - Capital spending: Strong capital spending, but inventory starts building up as sales growth slows Contraction - Economy: Weakens and may go into a recession - Activity levels: Below potential - Employment: Hiring freezes, then layoffs - Inflation: Decelerating, but with a lag - Capital spending: New orders halted and existing orders canceled, scale back on maintenance Business Cycle Theories - Neoclassical: “Invisible hand” lets markets reach a natural equilibrium; government should not intervene - Austrian: Like Neoclassical, focus on loose monetary policy causing credit-fueled booms - Keynesian: Countercyclical fiscal policy should be used to support aggregate demand - Monetarist: Oppose Keynesian fiscal focus, call for steady growth of money Unemployment - Unemployed: Jobless people who are seeking jobs - Labor force: People with a job or unemployed - Unemployment rate: Unemployed⁄Labor force Type Result of Frictional Temporary transitions Structural Cyclical Long-run changes in economy Changes in economic activity Inflation Deflation: Negative inflation rate Disinflation: Declining inflation rate Hyperinflation: Extremely high inflation rate Cost-push: From decrease in aggregate supply Demand-pull: From increase in aggregate demand Laspeyres index: Use base consumption basket Paasche index: Use current consumption basket Fisher index: ILaspeyres × Paasche Economic Indicators Leading: Stock indexes, building permits Coincident: Real income, industrial production Lagging: Unemployment rate, prime lending rate www.saltsolutions.com MONETARY AND FISCAL POLICY FISCAL POLICY INTRODUCTION TO GEOPOLITICS GEOPOLITICS INTRODUCTION TO Monetary Policy National Governments and Political Cooperation State actors possesses the authority to deploy a country’s national security resources Required reserves Required reserve ratio = Total deposits Money multiplier = 1⁄Reserve requirement Fisher effect: R *)'+*$Y = R -%$Y + π% Central Bank Roles - Sole currency supplier - Lender of last resort - Bank for commercial banks and government - Regulate and supervise payments system - Gold and foreign exchange reserves holder - Oversee monetary policy Monetary Policy Tools Expansionary monetary policy measures: - Policy rate: Set policy rate below neutral level - Reserve requirement: Reduce reserves for commercial banks - Open market operations: Buy bonds from commercial banks Fiscal Policy: Spending Tools Transfer payments: Redistribution of wealth (e.g., unemployment benefits) Current spending: Spending on goods and services Capital spending: Spending on infrastructure Fiscal Policy: Revenue Tools Direct taxes: Tax on income (e.g., income taxes, corporate taxes, capital gains taxes) Indirect taxes: Tax on goods and services Fiscal Multiplier 1 = , where MPC = marginal 1 − MPC(1 − t) propensity to consume; t = tax rate Difficulties Executing Fiscal Policy Recognition lag: Government must see need Action lag: Time needed to choose policy Impact lag: Policies do not have immediate impact Non-State Actors and the Forces of Globalization Non-state actors participate in global political, economic, or financial affairs but do not control a country's national security resources Assessing Geopolitical Actors and Risk The Tools of Geopolitics National security tool: Military force, espionage Economic tools: Currency union, nationalization Financial tools: Currency markets, sanctions, capital controls Incorporating Geopolitical Risk into the Investment Process Types of geopolitical risk: - Event risk - Exogenous risk - Thematic risk Assessing Geopolitical Threats To assess geopolitical risk, consider: - The likelihood of occurrence - The velocity (speed) of impact - The size and nature of impact INTERNATIONAL TRADE & CAPITAL FLOWS AND CAPITAL FLOWS Basics of International Trade Terms of trade: Price of exports/Price of imports Autarky: No trade with other countries Absolute advantage: Lower total cost of production Comparative advantage: Lower opportunity cost International Trade Models Ricardian: Labor is the only factor of production, comparative advantage due to labor productivity Hecksher-Ohlin: Both labor and capital are factors, income redistribution is possible through trade Trade Restrictions Tariffs: Taxes on imported goods Quotas: Limits on quantity of imported goods Export subsidies: Payments to exporters Minimum domestic content requirements Voluntary export restraints: Self-imposed limitations by foreign producers Copyright © 2021 Salt Solutions. All Rights Reserved. Personal copies permitted. Resale or distribution is prohibited. 6 Impact of Trade Restrictions - Price increases from P ∗ to P# - Domestic production increases from Q4 to Q < - Domestic consumption falls from Q F to Q D - Imports fall from (Q F − Q4 )to (Q D − Q < ) - Loss of consumer surplus = (A + B + C + D) - National welfare loss = (B + D) - Increase in producer surplus = A - Tariff revenue/Quota rent = C Regional Trading Blocs Free trade area (FTA): Free trade among members Customs union (CU): FTA + common trade policy Common market (CM): CU + free movement of factors of production within bloc Economic union (EU): CM + common economic institutions and coordination of economic policies Monetary union (MU): EU + common currency Balance of Payments Components Current account: Merchandise and services, income receipts, unilateral transfers Capital account: Capital transfers, non-financial assets sales/purchases Financial account: Government-owned assets abroad, foreign-owned assets in the country CURRENCYEXCHANGE EXCHANGERATES RATES CURRENCY Exchange Rate Calculations Real ex. rate&⁄W = Nominal ex. rate&⁄W × \ Forward exchange rate&⁄W 1 + i& = Spot exchange rate&⁄W 1 + iW CPIW ] CPI& Cross rate: S9⁄B = S9⁄[ × S[⁄B Forward exchange rates in points: - Unit of points is last decimal place in the rate quote (e.g., 1.5301 to 1.5302 is a 1-point increase) Ideal Currency Regime 1. Exchange rates are credibly fixed 2. Fully convertible currencies, free capital flows 3. Countries pursue independent monetary policies Such an ideal currency regime is NOT possible www.saltsolutions.com Exchange Rate Regimes Dollarization: Adopt another country’s currency Monetary union: Adopt a common currency Currency board: Commitment to exchange domestic currency at fixed exchange rate Fixed peg: Currency is pegged to foreign currency (or basket of currencies) within ±1% margin Target zone: Fixed peg with wider margin Crawling peg: Peg rate is periodically adjusted Crawling bands: Margin increases over time, usually to transition from fixed peg to floating Managed floating: Monetary authority intervenes, but no official target exchange rate Independently floating: Market sets exchange rate Marshall-Lerner Condition Currency devaluation can improve a country’s trade balance if demand elasticities cause export receipts to increase more than import expenditures FINANCIAL STATEMENT ANALYSISND ANALYSIS FINANCIAL STATEMENT ANALYSIS FINANCIAL REPORTINGSTANDARDS STANDARDS FINANCIAL REPORTING FASB, IASB, and IOSCO FASB: Sets forth US GAAP IASB: Establishes IFRS IOSCO: International body of regulatory authorities SEC: US capital markets regulator Fundamental Qualities of Financial Reports 1. Relevance 2. Faithful Representation Enhancing Characteristics 1. Comparability 2. Verifiability 3. Timeliness 4. Understandability UNDERSTANDING INCOMESTATEMENTS STATEMENTS UNDERSTANDING INCOME Revenue Recognition Revenue must not be recognized unless: - Risks of ownership have been transferred - Amount of revenue can be reliably measured - Customer is likely to pay - Transaction is unlikely to be reversed Service revenue may be recognized as earned Allowance for doubtful accounts: Contra-asset account, estimated based on historical experience Expense Recognition Matching principle: Expenses must be recognized in the same period as associated revenue Income Statement Line Items Revenue − Cost of goods sold (COGS) Gross Profit − Selling, General & Admin. (SG&A) EBITDA − Depreciation and Amortization EBIT (Operating profit) − Interest EBT (Earnings before taxes) − Taxes Net Income (NI) Separately Reported Items - Discontinued operations - Unusual or infrequent items (US GAAP only) - Non-operating items Basic Earnings per Share Net income − Preferred dividends Weighted average of shares outstanding Diluted Earnings per Share Convertible Convertible Net Preferred (1 − 𝑡𝑡) − + preferred + debt income dividends interest dividends Weighted Shares from Shares from Shares issuable average + preferred + convertible + from stock options debt shares shares Must be equal to or less than basic EPS UNDERSTANDING BALANCESHEETS SHEETS UNDERSTANDING BALANCE Classified Balance Sheet Current Assets: To be used within one year - Cash and equivalents - Marketable securities - Accounts receivable, net of bad debt expense - Inventories - Other (e.g., prepaid expenses) Non-Current Assets - Property, Plant, and Equipment (PP&E) - Investment property - Intangible assets - Goodwill - Financial assets Current Liabilities: To be settled within one year - Accounts payable - Notes payable - Accrued expenses - Deferred income (Unearned revenue) Long-term Liabilities - Long-term debt - Deferred tax liabilities Equity - Contributed capital - Preferred shares - Treasury shares - Retained earnings - Accumulated other comprehensive income (OCI) - Non-controlling (minority) interest Copyright © 2021 Salt Solutions. All Rights Reserved. Personal copies permitted. Resale or distribution is prohibited. 7 UNDERSTANDINGCASH CASHFLOW FLOWSTATEMENTS STATEMENTS UNDERSTANDING FINANCIAL ANALYSIS ANALYSIS TECHNIQUES TECHNIQUES Cash Flow Statement Classifications CFO: Cash flows from regular operations CFI: Cash flows for buying/selling long-term assets CFF: Financial transactions with capital providers Common-Size Analysis Vertical: - State income statement items as % of revenue - State balance sheet items as a % of total assets - State each cash flow statement item as a % of total cash inflows/outflows Horizontal (Trend) Analysis: - State each item relative to its base-year value Item US GAAP IFRS CFF CFO/CFF CFO CFO/CFI Dividends paid Interest paid CFO Tax expenses CFO Dividends received Interest received CFO CFO/CFF CFO/CFI CFO* *IFRS treat tax expenses for investing or financing transactions as CFI or CFF CFO Direct Method - Convert each accrual-based item in the income statement to cash inflow/outflow - CFO is net of cash inflows and outflows CFO Indirect Method - Start with net income - Add noncash expenses (e.g., Depreciation) - Subtract gains/add losses - Add increases in current liabilities - Subtract increases in (non-cash) current assets Beginning accounts receivable + Revenue − Ending accounts receivable Cash collected from customers Cost of goods sold + Increase in inventory Purchases from suppliers − Increase in accounts payable Cash paid to suppliers Free Cash Flow (FCF) Free cash flow to the firm (FCFF): Cash available to equity owners and debt holders. FCFF = NI + NCC + I × (1 − t) − FCI − WCI FCFF = CFO + I × (1 − t) − FCI Free cash flow to equity (FCFE): Cash flow available to common shareholders FCFE = CFO − FCI + Net Borrowing Activity Ratios Receivables turnover = Annual sales Average receivables 365 Days of sales = outstanding Receivables turnover Inventory turnover = Cost of goods sold Average inventory Solvency Ratios Debt-to-equity = Debt-to-capital = Debt-to-assets = Total debt Total shareholders' equity Total debt Total shareholders' Total debt + equity Total debt Total assets Financial leverage = Interest coverage = Average total assets Average total equity EBIT Interest payments Fixed EBIT + Lease payments charge = Interest payments + Lease pmts coverage Profitability Ratios Net income Revenue 365 Days of inventory = Inventory turnover on hand Net profit margin = 365 Number of days = of payables Payables turnover Operating profit margin = EBIT Revenue Revenue Average net fixed assets Revenue Working capital = Average working capital turnover Return on assets (ROA) = Net income Average total assets Payables turnover = Purchases Average trade payables Revenue Total asset turnover = Average total assets Fixed asset turnover = Liquidity Ratios Current ratio = Current assets Current liabilities Marketable Cash + + Receivables securities Quick ratio = Current liabilities Cash ratio = Defensive = interval Cash + Marketable securities Current liabilities Marketable + Receivables securities Average daily expenditures Cash + Number Days of Cash Days of conversion = sales + inventory − of days cycle payables outstanding on hand Gross profit margin = Pretax margin = Gross profit Revenue EBT Revenue Return on total capital = EBIT Average total capital Return on equity (ROE) = Valuation Ratios Dividend payout ratio = Net income Average total equity Dividends declared NI available to common Retention rate (RR) = 1 − Dividend payout ratio Sustainable growth rate (g) = RR × ROE P/E Ratio = Price per share Earnings per share DuPont Analysis Net income Assets ROE = \ ]\ ] Assets Book Value of Equity Leverage = (ROA) > ? ratio =\ =\ =/ NI Revenue Assets ]\ ]\ ] Revenue Assets Equity Net profit Asset Leverage ]> ?> ? margin turnover ratio EBT EBIT Revenue Assets NI 5/ 5/ 5/ 5/ 5 Assets Equity EBT EBIT Revenue EBIT Financial Asset Interest Tax ? 59 ?+ 59 5+ =+ burden burden margin turnover leverage www.saltsolutions.com Copyright © 2021 Salt Solutions. All Rights Reserved. Personal copies permitted. Resale or distribution is prohibited. 8 INVENTORIES INVENTORIES Depreciation Methods Inventory Valuation Requirements IFRS: Lower of cost or net realizable value US GAAP: Lower of cost or market value Reversals of inventory write-downs are allowed under IFRS, but not under US GAAP Inventory Valuation Methods and Systems FIFO LIFO Weighted average Specific Identification US GAAP IFRS Allowed Allowed Allowed Allowed Allowed N/A Allowed Allowed Impact of Inventory Valuation Method If prices are rising FIFO LIFO Ending Inventory Higher Lower Income Tax Expense Higher COGS Net income Operating cash flow Lower Higher Lower Higher Higher Lower Lower Perpetual vs. periodic inventory system: - Periodic system matches total units sold for the period with total purchases for the same period - Perpetual system updates after each transaction - Under FIFO, ending inventory and COGS are the same for periodic or perpetual - Weighted average and LIFO will show differences LIFO Reserve Used to adjust LIFO COGS and ending inventory (EI) to FIFO-equivalent values EI\X\] = EI^X\] + LIFO Reserve COGS\X\] = COGS^X\] − ΔLIFO Reserve Tax\X\] = Tax^X\] + ΔLIFO Reserve × t LIFO Liquidations - Happen when units sold exceed units purchased - May result in higher gross profit than otherwise LONG-LIVEDASSETS ASSETS LONG-LIVED Long-Term Assets Property, plant, and equipment (PP&E): IFRS - Both cost model and revaluation model allowed - Recoverable amount is greater of: (1) fair value less selling costs, and (2) value in use (PV of asset’s future cash flows) - Loss recoveries are allowed US GAAP – Only cost model is allowed – Loss recoveries not allowed www.saltsolutions.com Straight-line: = EFGH%IJKLJMN LJKON PNQ!NRSJTKN KSUN Double-declining balance (DDB): Book value# Depreciation# = \ ]× 2 Depreciable life Units-of-production: Cost − Salvage × Output units# Depreciation# = Total output Intangible Assets Purchased: Record at fair value (purchase price) Developed internally: IFRS - Research expenditures are expensed - Development expenditures are capitalized US GAAP - Generally, both R&D costs are expensed Acquired in business combination: Purchase price is allocated to each asset on fair value basis; excess recorded as goodwill Capitalizing vs. Expensing - Capitalizing increases assets on the balance sheet and investing cash outflows - Expensing reduces net income by the after-tax expenditure amount in the period it is incurred Impairment of PP&E and Intangible Assets US GAAP - Asset tested for impairment only when firm may not recover carrying value through future use - Asset is impaired when carrying value exceeds asset’s future undiscounted cash flows - Impaired asset’s value is written down to fair value and a loss is recognized and cannot be subsequently reversed IFRS - Assets are tested annually for impairment - Impaired if carrying value > recoverable amount - Impaired asset’s value is written down to recoverable amount and a loss is recognized - Loss can be reversed if asset value recovers, but only up to pre-impairment carrying value INCOME TAXES Temporary Taxable Differences Deferred tax assets (DTA): Created when taxes payable exceeds income tax expense Deferred tax liabilities (DTL): Created when taxes payable is less than income tax expense Tax base of assets: Amount that will be deducted on the tax return as asset’s benefits are realized Tax base of liabilities: Carrying value of liability minus amount that will be deductible Asset carrying amount > Tax base DTL Liability carrying amount < Tax base DTL Asset carrying amount < Tax base Liability carrying amount > Tax base DTA DTA Impact of tax rate changes If tax rate increases, DTA and DTL will increase If tax rate decreases, DTA and DTL will decrease Income tax exp. = Taxes payable + ΔDTL − ΔDTA Valuation Allowance Contra account used if it is unlikely that future profits will be sufficient to use DTAs and credits Deferred Tax Charges Directly to Equity - Revaluation of PP&E (IFRS only) - Impact of changes in accounting policies - Impact of exchange rate fluctuations - Changes in fair value of certain investments NON-CURRENT (LONG-TERM)LIABILITIES LIABILITIES NON-CURRENT (LONG-TERM) Long-Term Liabilities Premium bond: Coupon rate > yield at issuance Discount bond: Coupon rate < yield at issuance Issuance costs: US GAAP – capitalized as an asset IFRS – reduces initial bond liability Derecognition of debt: If an issuer redeems a bond before maturity, a gain/loss (book value minus redemption price) is recognized Debt covenants: Affirmative – borrower promises to do certain things; negative – borrower promises to refrain from certain things Lessee Accounting US GAAP Finance lease: - Lessee purchases the asset, financed by the lessor - Lessee's periodic lease payments have separate depreciation and interest components Operating lease (like a rental agreement): - Single lease expense, not separated into different components for depreciation and interest - The value of an operating lease payment is calculated as a straight-line allocation of total payments over the term of the lease Copyright © 2021 Salt Solutions. All Rights Reserved. Personal copies permitted. Resale or distribution is prohibited. 9 Conditions requiring a lease to be a finance lease: - Ownership of the leased asset is transferred to the lessee - Lessee has the option to purchase the asset and will likely do so - Lease term covers most of asset's useful life - The present value of lease payments at inception is close to the asset’s fair value - The leased asset is so specialized that only the lessee can use it without modification IFRS require all leases to be treated in the manner that is prescribed by US GAAP for finance leases. Lessor Accounting - For operating leases (under both IFRS and US GAAP), the lessor retains the leased asset on its balance sheet and incurs the associated depreciation expense. Lease income from the lessor is recorded as revenue. - For finance leases (under both IFRS and US GAAP), the lessor removes the leased asset from its balance sheet and creates an asset with a value equal to the lease receivable and any residual value. - Lease payments are recognized as an operating inflow on the lessor’s cash flow statement (for both operating leases and finance leases) Pensions Defined benefit (DB): Firm makes periodic payments to employee after retirement. Overfunded (underfunded) plan is recognized as an asset (liability). CORPORATECORPORATE ISSUERS ISSUERS CORPORATESTRUCTURES STRUCTURESAND ANDOWNERSHIP OWNERSHIP CORPORATE Sole Proprietorship - Extension of owner - Operated by owner - Business liability is retained by owner - Business profits are owned by owner and taxed as personal income - Owner is the main source of capital - Owner’s capital and risk appetite limit business growth General Partnership - Set by partnership agreement - Operated by partner - Business liability is retained and shared by partners - Business profits are shared by partners and taxed as personal income - Partners are the main source of capital - Partners’ resources and risk appetite limit business growth www.saltsolutions.com Limited Partnership - Set by partnership agreement - Operated by GP - Business liability is limited by LPs and unlimited for GP - Business profits are shared by partners and taxed as personal income - Partners are the main source of income - Partners’ resources, risk appetite, and GP’s competence/integrity limit business growth Corporations (Limited Companies) - Legal identity is separated from owners - Operated by management team voted by shareholders - Limited business liability for shareholders - Financed by equity and debt - Profits are taxed directly; double taxation occurs when shareholders are taxed on their dividend income Public and Private Corporations Market capitalization: Product of the current share price and the number of outstanding shares Enterprise value = MVShares + MVDebt – Cash Private placement memorandum (PPM) is used by private companies to raise capital in primary market Private companies can go public by: - Initial public offering (IPO) - Direct listing (DL) - Acquisition Public companies can go private by: - Leveraged buyout (LBO) - Management buyout (MBO) Lenders and Owners Risk vs return characteristics of equity and debt: Upside potential Maximum loss Investment risk Investment interest Equity Debt Unlimited Limited to payments Higher Lower Cannot be more than the investment value Maximize company value Timely repayment INTRODUCTION TO CORPORATE CORPORATEGOVERNANCE GOVERNANCE INTRODUCTION TO AND CONSIDERATIONS AND OTHER OTHER ESG ESG CONSIDERATIONS Stakeholder Groups Principal-Agent and Other Relationships Shareholder vs. manager/director - Entrenchment: Managers avoid justifiable risks to avoid losing their positions - Empire building: Making unjustified acquisitions to increase company size and compensation - Excessive risk taking: Taking unjustifiable risks to maximize returns on stock-based compensation - Agency costs reduce the potential for exploitation in an agency relationship Controlling shareholder vs. minority shareholder - Dispersed ownership: Controlled by many minority shareholders - Concentrated ownership: Controlled by a single shareholder - Multiple-class share structures: Disproportionate voting power to certain shareholder classes Shareholder vs. creditor - Equity owners prefer growth and have a higher risk tolerance - Creditors prefer stability and limited downside risk Corporate governance can be described as: - A system of internal controls and procedures for managing organizational business - A framework for defining the rights and responsibilities of individuals and groups within the organization - An arrangement of checks, balances, and incentives to minimize and manage conflicts between the interests of insiders and external stakeholders Stakeholder Mechanisms Shareholder: - Corporate reporting and transparency - Shareholder meetings (cumulative voting, proxy voting) - Shareholder activism - Derivative lawsuits - Corporate takeovers (proxy contests, tender offers, hostile takeovers) Creditor: - Bond indentures, collateral, and trustees - Corporate reporting - Creditor committees Board of director and management: - Audit committee - Governance committee - Remuneration/Compensation committee - Nomination committee - Risk committee - Investment committee Copyright © 2021 Salt Solutions. All Rights Reserved. Personal copies permitted. Resale or distribution is prohibited. 10 Employee: - Labor laws - Code of ethics and compliance department - Whistleblower protections - Employee contracts Customer and supplier: - Commercial contracts - Public reputation and social media Government: - Laws and regulations - Corporate governance codes - Common law and civil law systems Risks and Benefits of Corporate Governance and Stakeholder Management Operational risks of poor stakeholder governance: - Weak control systems that do not treat all stakeholders fairly - Ineffective decision-making process - Inadequate board scrutiny - Diminished operating performance Financial risks of poor stakeholder governance: - Higher default and bankruptcy risks - Higher borrowing costs - Poor equity returns Factors Relevant to Corporate Governance and Stakeholder Management Analysis - Economic ownership and voting control - Board of directors representation - Remuneration and company performance - Investors in the company - Strength of shareholders’ rights - Management of long-term risks ESG Considerations for Investors and Analysts ESG investment approaches: - Responsible investing - Sustainable investing - Socially responsible investing (SRI) - Value-based and values-based approaches ESG investment styles: - Negative screening - Positive screening - ESG integration - Thematic investing - Engagement/active ownership - Impact investing Green finance: Use financial instruments to support economic growth while minimizing environmental impact BUSINESS MODELS&&RISKS RISKS BUSINESS MODELS Value Proposition - Target customers - Product/service offering - Channel strategy - Pricing strategy Channel strategy: - Traditional channel - Direct sales - Drop shipping - Omnichannel strategy Pricing model: - Cost-based - Value-based Price discrimination: - Tiered pricing - Dynamic pricing - Auction/reverse auction models Pricing for multiple products: - Bundling - Razors-and-blades pricing - Optional product pricing Pricing for rapid growth: - Penetration pricing - Freemium pricing - Hidden revenue business model Alternatives to ownership: - Subscription pricing - Fractionalization - Leasing - Licensing - Franchising Value Chain Value chain: Systems and functions within the firm that create value for its customers Supply chain: Series of steps and processes needed to prepare a product to be sold to the consumer Profitability and Unit Economics Unit economics: The quantitative analysis of a company's revenues and costs on a per unit basis Fixed costs Breakeven point = Contribution margin Fixed costs = Unit price − Variable cost per unit Business Model Types - Private label manufacturers - Licensing arrangements - Value added resellers - Franchises - Network effects - Crowdsourcing - Hybrid business models E-commerce business models: - Affiliate marketing - Marketplace businesses - Aggregators www.saltsolutions.com Business Models: Financial Implications External factors: - Economic conditions - Demographics - Sector demand - Industry cost characteristics - Social and political trends Firm-specific factors: - Firm maturity - Competitive position - Business model Business Models: Risks Macro risk: - Exchange rates - Interest rates - Political instability - Legal and regulatory changes - Country-level risks Business risk: - Industry risks - Company-specific risks Financial risk: Total leverage = Operating leverage × Financial leverage Contribution margin EBIT × = EBT EBIT Contribution margin = EBT CAPITAL INVESTMENTS INVESTMENTS CAPITAL Types of Capital Investments Business maintenance: - Going concern projects - Regulatory/compliance projects Business growth: - Expansion projects - Pet projects/high-risk investments Principles of Capital Budgeting Key assumptions of capital allocation: - Decisions are based on cash flows instead of accounting concepts - Cash flows are not equivalent to accounting income or economic income - Cash flows must account for opportunity costs - Analysis is done on an after-tax basis - Timing of cash flows is important - Financing costs are ignored Other important considerations: - Sunk costs are ignored - Opportunity cost is the value of a resource’s nextbest use - Incremental cash flows reflect the cash flows realized from a decision - Externalities (e.g., cannibalization) may have unexpected negative impact the company - Conventional cash flow pattern only has one sign change Copyright © 2021 Salt Solutions. All Rights Reserved. Personal copies permitted. Resale or distribution is prohibited. 11 Net Present Value (NPV) Sum of present values of expected future cash inflows, net of initial cash outlay * NPV = F #34 CF# − Outlay (1 + r)# Accept a project if NPV > 0 Internal Rate of Return (IRR) IRR is r such that NPV = 0 Accept a project if its IRR > required return BA II Plus NPV Worksheet Function - Cash inflows are positive; outflows are negative - F01, F02, etc. refer to cash flow frequencies - CPT + NPV to compute NPV; CPT + IRR for IRR Common Capital Budgeting Pitfalls - Inertia - Source of capital bias - Failing to consider alternatives - Pet projects - Basing decisions on earnings metrics - Internal forecasting errors Corporate Usage of Capital Allocation Methods Return on invested capital (ROIC): After-Tax Net Profit ROIC = Average BV of Invested Capital Real Options - Timing option: Option to delay the investment - Sizing option: Option to expand, grow, or abandon - Flexibility option: Option to alter operations, such as changing prices or substituting inputs - Fundamental option: Option to alter decisions based on future events (e.g., drill based on price of oil, continue R&D depending on initial results) Analyzing Projects with Real Options - Use the discounted cash flow (DCF) analysis without considering real options - Adjust the stand-alone DCF analysis by including the present value of the expected costs and benefits options - Use option pricing models - Use decision trees WORKING CAPITAL CAPITAL & & LIQUIDITY LIQUIDITY WORKING Internal Financing - Increasing after-tax operating cash flows - Improving working capital efficiency - Converting liquid assets to cash External Financing: Financial Intermediaries - Uncommitted lines of credit - Committed lines of credit - Revolving credit agreements - Secured (asset-based) loans - Factoring - Others (web-based lenders and non-bank lenders) www.saltsolutions.com External Financing: Capital Markets - Short-term commercial paper - Long-term debt - Common equity Conservative Working Capital Management Advantages: - Low rollover risk - Greater cash flow certainty - Low risk of inventory shortages - Flexibility to adapt to adverse market conditions Disadvantages: - High borrowing costs - High cost of equity and shareholder dilution - Less flexibility to borrow on an as-needed basis - Longer lead times - More covenants - High risk of obsolete inventory Aggressive Working Capital Management Advantages: - Low financing costs under an upward-sloping yield curve - Great flexibility to borrow only as needed - Short-term borrowing involves less rigorous credit analysis Disadvantages: - Risk of having to refinance at higher short-term rates - Potential difficulty rolling over short-term debt with market turmoil - Possible need to rely on expensive trade credit - Tight customer credit terms Liquidity and Short-Term Funding Needs Primary sources of liquidity: - Free cash flows - Ready cash balances (bank accounts) - Short-term funds (lines of credit) - Cash flow management (centralized collection) Secondary sources of liquidity: - Negotiating debt contracts - Liquidating assets - Filing for bankruptcy Drag on liquidity: Delayed cash inflows, such as uncollected receivables and obsolete inventory Pull on liquidity: Accelerated cash outflows, such as settling payables earlier Net operating cycle (a.k.a. cash conversion cycle) = # days of inventory + # days of receivable – # days of payable Evaluating Short-Term Financing Choices Factors influencing a company’s short-term borrowing strategy: - Size and creditworthiness - Legal and regulatory considerations - Sufficient access - Flexibility of borrowing options COST OF OF CAPITAL CAPITAL –- FOUNDATIONAL TOPIC TOPIC Weighted Average Cost of Capital (WACC) WACC = w& r&(1 − t) + w. r. + w% r% w& = percentage of debt in capital structure w. = percentage of preferred stock w% = percentage of common stock t = tax rate r& = cost of debt r. = cost of preferred stock = D. ⁄P r% = cost of common stock = R \ + β[E(R ' ) − R \ ] (CAPM) = r& + Risk Premium (Bond Yield plus Risk Premium) Costs of the Various Sources of Capital Cost of debt: - Yield-to-maturity approach PQ = â∑*+34 012" 1 " _4L (% ` ä+ \a 1 _4L (%` 2 - Debt rating approach (e.g., matrix pricing) Cost of preferred stock: r. = D. ⁄P Cost of common stock: - Yield-to-maturity approach r% = rW + β[r' − rW ] - Multifactor model r% = rW + β4(Factor4 ) + β<(Factor< ) + ⋯ + βI mFactorI n - Bond yield plus risk premium approach r% = r& + Risk Premium Estimating Beta Blume’s beta adjustment formula: 2 1 Adjusted β = \ ] (Unadjusted β) + \ ] (1.0) 3 3 Asset beta/unlevered beta for comparable company: βb = βE û 1 ü D E+1 Levered project beta for subject firm: Dc βcE = βb †(1 − t) c + 1° E (1 − t) Flotation Costs r% adjusted for flotation costs (amount): D4 +g r% = PQ − F r% adjusted for flotation costs (percentage): D4 +g r% = PQ [1 − f] Copyright © 2021 Salt Solutions. All Rights Reserved. Personal copies permitted. Resale or distribution is prohibited. 12 STRUCTURE CAPITAL STRUCTURE Internal Factors Affecting Capital Structure Business model characteristics: - Revenue, earnings, and cash flow sensitivity - Asset type - Asset ownership Existing leverage: - Liquidity - Profitability - Interest coverage - Leverage Corporate tax rate: The higher the tax rate, the more benefit of using debt Capital structure policies/guidelines: Firm-specific policies and debt covenants Company life stage: External Factors Affecting Capital Structure - Market conditions/business cycles - Regulatory constraints - Industry/peer firm leverage Modigliani and Miller Propositions MM Proposition I: A firm's capital structure would have no effect on its value, assuming: 1. Investors have homogeneous expectations 2. No market frictions (e.g., transaction costs, taxes, or costs of financial distress) 3. No agency costs 4. Investors can borrow and lend at risk-free rate 5. Investing/financing decisions are independent MM Proposition II: Cost of equity increases with the debt-to-equity ratio. Without Taxes Firm value Cost of Equity With Taxes Firm value Cost of Equity V^ = Vb D r% = rQ + (rQ − r& ) \ ] E V^ = Vb + tD D r# = r! + (r! − r$ )(1 − t) / 5 E r! = cost of capital for a firm financed only by equity Optimal and Target Capital Structure Static trade-off theory balances costs of financial distress with tax shield benefits from using debt: V^ = Vb + tD − PV(costs of financial distress) Breakeven Breakeven: Q BE = F P−V Q = quantity; P = price; V = variable cost/unit F = fixed operating cost; C = fixed financial cost Operating breakeven: Q ]BE = EQUITY To estimate a company’s target capital structure: - Assume the company will main its current capital structure - Infer target weights the company is moving toward - Use the industrial average Pecking order theory: Since managers have an asymmetric information advantage, they prefer capital sources that reveal the least amount of information: 1. Internally generated earnings (best option) 2. New debt 3. New equity (least attractive for managers) Stakeholder Interests Agency costs arise from conflicts between managers and owners. The interests of managers, shareholders, and bondholders are not always aligned. MEASURES OFLEVERAGE LEVERAGE MEASURES OF Leverage EQUITY MARKET AND STRUCTURE STRUCTURE MARKET ORGANIZATION ORGANIZATION AND Functions of the Financial System - Saving - Borrowing - Raising Equity Capital - Managing Risks - Exchanging Assets - Information-Motivated Trading Securities Markets - Spot vs. Forward Markets: Spot market trades are settled within 3 days. - Primary vs. Secondary Markets: Primary market transactions are done directly with the issuer, while secondary market trades take place on organized exchanges. - Capital vs. Money Markets: Money markets are used for securities with maturities of less than one year, while longer-dated securities are traded in capital markets. Positions Long positions: Benefit from price appreciation Short positions: Benefit from price depreciation Leveraged Positions Position Leverage ratio = Equity 1 Intial margin Maintenance margin: minimum amount of equity required Margin call is triggered if the equity falls below the maintenance margin. Additional equity will be requested to bring the account balance back to the initial margin. Maximum initial leverage ratio = Business Risk Two components of business risk are: - Sales risk: determined by the elasticity of demand for products and services - Operating risk: determined by the share of fixed costs as a share of total operating costs Measures of Leverage Degree of operating leverage (DOL): %Δ Operating income Q(P − V) DOL = = %Δ Units sold Q(P − V) − F Degree of financial leverage (DFL): %Δ Net income Q(P − V) − F DFL = = %Δ Operating income Q(P − V) − F − C Degree of total leverage (DTL): %Δ Net income Q(P − V) DTL = = %Δ Units sold Q(P − V) − F − C DTL = DOL × DFL www.saltsolutions.com F+C P−V Execution Instructions (How to fill) - Market: Fill immediately at market price - Limit: Buy below maximum price or sell above minimum price specified in order - All-or-nothing: Cancel order if not fully filled - Hidden: Visible to brokers and exchanges, but invisible to other traders - Iceberg: Only a fraction of order amount is visible Validity Instructions (When to fill) - Day orders: Cancelled if unfilled at end of day - Good-till-cancelled: No set expiry date - Good-on-close: Filled at end of day - Stop-loss: Sell if prices fall below specified level Copyright © 2021 Salt Solutions. All Rights Reserved. Personal copies permitted. Resale or distribution is prohibited. 13 Clearing Instructions Settlement/clearing typically done by brokers for retail trades; brokers or custodians for institutional trades Primary Market Transactions - Initial Public Offerings (IPOs) - Private placements - Shelf registrations: Part of issue is held back to be sold directly to secondary market investors later - Dividend reinvestment plans (DRIPs): Investors can roll over dividend payments to purchase new shares, possibly at a discount - Rights offerings: Current shareholders gain right to purchase additional shares at below-market price; dilutes value of existing shares Market Structure Quote-driven: Investors trade with dealers Order-driven: Exchanges use order matching rules Brokered: Trades arranged by brokers Call markets: Conduct periodic single price auctions, otherwise completely illiquid Continuous Trading markets: Allow trades whenever market is open, may use call market auction at beginning and/or end of each day Trade Pricing Rules Uniform pricing rules: Used by call markets, all trades executed at the price that maximizes total quantity traded Discriminatory pricing rules: Used by continuous markets, fills most aggressively priced orders first Derivative pricing rules: Used by crossing networks to trade at midpoint of quotes from other markets Complete Markets - Facilitate savings/investment - Facilitate lending to creditworthy borrowers - Allow risk exposures to be hedged - Facilitate exchange of currencies/commodities An ideal financial system is complete (see above), operationally efficient (low transaction costs), and informationally efficient (prices reflect all info.) SECURITY MARKET MARKET INDEXES INDEXES SECURITY Price Return over Single Period P+4 − P+Q PR + = P+Q ! PR X = F w+ PR + +34 Total Return over Single Period TR + = P+4 − P+Q + Inc+ P+Q ! TR X = F w+ TR + +34 Price Return Index over Multiple Periods V0dX2 = V0dXQ (1 + PR X4 )(1 + PR X< ) … (1 + PR X2) Total Return Index over Multiple Periods V2dX2 = V2dXQ (1 + TR X4 )(1 + TR X< ) … (1 + TR X2 ) www.saltsolutions.com Price-Weighted Indexes P+ w+0 = ! ∑I34 PI - Like buying one share of each stock - Advantage is simplicity - Disadvantage is arbitrary weights - A stock’s weight is halved due to a stock split, requiring an adjustment to the divisor Equally Weighted Indexes 1 w+E = N - Like investing the same amount in each stock - Advantage is simplicity - Disadvantages are that the impact of large companies is underrepresented and frequent rebalancing is required Capitalization-Weighted Indexes Q + P+ w+1 = ! ∑I34 Q I PI - Like holding all stocks in proportion to their market values - Float adjustment may be used to reflect the number of shares that may be actively traded - Advantage is that the asset classes’ performance is well-represented - Disadvantage is that returns are heavily driven by large-cap (possibly overvalued) firms Fundamentally Weighted Indexes - Built like price-weighted indexes, but using a fundamental measure such as sales or cash flows - Contrarian effect of rebalancing by selling off top performers and buying underperforming stocks produces a value tilt Types of Equity Market Indexes - Broad market indexes: Covers one equity market - Multi-market indexes: Covers equity markets in multiple countries - Sector indexes: Important for assessing a manager’s performance (selection vs. allocation) - Style indexes: Large/small cap; Value/growth MARKET MARKET EFFICIENCY EFFICIENCY Forms of Efficient Market Hypothesis (EMH) Form Weak Semistrong Strong Market Prices Reflect: Past market data ✔ Public info ✔ ✔ ✔ ✔ Private info Implications of EMH - If weak form holds, investors will not earn abnormal profits from technical analysis - If markets are semi-strong efficient, investors must have a comparative advantage to earn abnormal profits from fundamental analysis Market Anomalies Changes in a security’s price that are not attributable to known information Selected Behavioral Biases - Loss aversion: Disliking losses more than liking equivalent gains - Information Cascades: Those who act first will convey information that influences others - Representativeness: Rely too much on current state when assessing probabilities - Mental accounting: Keep track of gains and losses separately for different investments/goals - Conservatism: Failing to incorporate new information in a timely manner - Narrow framing: Focusing on certain issues in isolation OVERVIEW OVERVIEW OF OF EQUITY EQUITY SECURITIES SECURITIES Common Share Voting Methods Statutory: One vote per share Cumulative: Votes can be bundled Example: 10 board positions Statutory: 1 share votes for 10 different candidates Cumulative: 10 votes may go to 1 candidate Cumulative method advantages small shareholder Preference Shares - Cumulative: Accrue dividends if payments missed - Non-cumulative: Missed dividends do not accrue, but no common dividends allowed if preferred shareholders do not receive their dividend - Participating: May receive additional dividend if firm is profitable or in the event of liquidation - Non-participating: No compensation beyond dividends and face value in a liquidation Private Equity Securities - Venture capital (VC): Start-up, early-state, or mezzanine financing with IPO as exit strategy - Leveraged buyouts (LBO): Debt-financed deals to take undervalued listed companies private - Private investment in public equity (PIPE): Companies can raise new capital quickly, investors can negotiate discounts ✔ Copyright © 2021 Salt Solutions. All Rights Reserved. Personal copies permitted. Resale or distribution is prohibited. 14 Depository Receipts (DRs) Sponsored DRs: Issued directly by foreign company; Investors receive same voting rights and dividends as other common shareholders Unsponsored DRs: Foreign company not involved; Depository bank purchases shares, issues DRs, and retains voting rights Global DRs: Issued outside company’s home country to avoid limits on capital flows; May be denominated in any currency, but USD is common; Cannot be listed on US exchanges, but US investors can purchase them via private placements American DRs: USD-denominated GDRs that can be traded on US exchanges; Underlying securities, American depository shares, trade in issuer’s domestic market Global Registered Shares: Traded on multiple exchanges, including issuer’s domestic market; Denominated in multiple local currencies; Unlike DRs, GRS represent an actual ownership interest INTRODUCTIONTO TOINDUSTRY INDUSTRY&AND INTRODUCTION COMPANY COMPANY ANALYSIS ANALYSIS Porter’s Five Forces Framework - Threat of substitute products - Bargaining power of customers - Bargaining power of suppliers - Threat of new entrants - Intensity of rivalry Industry Life Cycle Stages - Embryonic: Slow growth, high prices, high failure risk, significant investment required - Growth: Rapidly increasing demand, improving profitability, falling prices, low competition - Shakeout: Slowing growth, intense competition, declining profitability - Mature: Little or no growth, industry consolidation, high entry barriers - Decline: Negative growth, excess capacity, high competition Key Competitive Strategies - Low-cost leadership: To hold/gain market share - Product differentiation: To charge premium prices ANDBASIC EQUITY VALUATION: CONCEPTS CONCEPTS AND BASIC TOOLS TOOLS Dividend Discount Model (DDM) e VQ = F #34 * D# D# P* =F + (1 + r)# (1 + r)# (1 + r)* #34 Perpetual preferred stock; constant dividend: DQ VQ = r Gordon constant growth model (GGM): e VQ = F #34 DQ (1 + g)# DQ (1 + g) D4 = = (1 + r)# r−g r−g Multistage DDM: * VQ = F #34 D# P* + (1 + r)# (1 + r)* D*L4 r − g^ D*L4 = DQ (1 + g S )* (1 + g ^ ) P* = Price Multiples PQ D4 /E4 = E4 r−g P⁄B = Price per share⁄Book value per share P⁄CF = Price per share⁄Cash flow per share P⁄S = Price per share⁄Sales per share Asset-Based Valuation Models Useful for companies with natural resource or a large share of current assets/liabilities; Not useful if company has a large share of PP&E/intangibles Enterprise Value (EV) = MV(Common equity) + MV(Preferred stock) + MV(Debt) − (Cash + Short term investments) FIXED INCOME FIXED INCOME FIXED-INCOME SECURITIES:DEFINING FIXED-INCOME SECURITIES: ELEMENTSELEMENTS DEFINING Types of Bonds - Collateral Trust Bonds: Backed by financial assets - Equipment Trust Bonds: Backed by physical assets - Covered Bonds: Backed by a segregated pool of loans that are replaced if they stop performing Principal Repayment Structures - Bullet Bonds: Full principal repaid at maturity - Fully Amortizing: Equal annuity-like payments contain a mix of interest and principal - Partially Amortizing: Some principal is amortized, remainder repaid as a lump sum at maturity - Sinking Funds: Certain percentage of principal retired each year Coupon Structures - Fixed-rate bonds: Set percentage of principal - Floating-rate (FRNs): Reference rate + spread - Step-up: Coupon rate increases on schedule - Credit-Linked: Coupon rate is increased if issuer is downgraded, reduced if upgraded - Payment-in-kind: Coupons may be paid with more bonds rather than cash - Deferred (Split) Coupon: No coupons in early years, high coupons in later years Inflation-Indexed Bonds - Zero-coupon: Principal amount is adjusted - Interest-indexed: Coupons are adjusted - Capital-indexed: Fixed rate, adjusted principal - Indexed-annuity: Amortizing bonds with annuity payments adjusted for inflation Credit Enhancements Internal: Subordination, over-collateralization, reserve accounts External: Surety bonds, letters of credit, guarantees from financial institutions Bonds with Contingency Provisions Callable Bonds May be recalled by issuer if rates fall V[$YY$UY% U)*& = VNon-callable bond − V[$YY Putable Bonds May be sold back to issuer if rates rise V0,#$UY% U)*& = VNon-putable bond + V0,# Convertible Bonds Conversion price: Price per share at which bond can be converted into shares Conversion ratio: Number of common shares each bond can be converted into Conversion value: Current share price × Conversion ratio Conversion premium: Convertible bond’s price − Conversion value Warrants: Options to buy equity, lowers debt costs Convertible Contingent Bonds (CoCos) - Automatically convert to equity if a condition is met (e.g., capitalization ratio falls) - Lender does not control if option is exercised - Primarily issued by financial institutions FIXED-INCOME MARKETS: ISSUANCE, ISSUANCE,TRADING, FIXED-INCOME MARKETS: TRADING, AND FUNDING AND FUNDING Bond Markets - Primary bond markets: Markets in which issuers initially sell bonds to investors to raise capital - Secondary bond markets: Markets in which bonds are subsequently traded among investors; Most trading is OTC rather than on organized exchanges - Grey market: Informal forward market to gauge interest in upcoming bond issues and set prices for the primary market Sovereign Debt - Issued by national governments, zero default risk - Bills mature < 1 year; Bonds mature > 1 year - On-the-run: Most recent issues of a given maturity; more liquid than off-the-run issues Non-Sovereign Debt - Municipal bonds (sub-national issuers) - Quasi-government bonds (gov’t-backed agencies) - Supranational bonds (i.e., IMF, World Bank) Corporate Debt - Commercial paper (CP) used for < 1 year, but carries rollover risk - Long-term bonds ~12+ years - Bilateral/syndicated bank loans are also used g = (Retention rate) × ROE = (1 − D⁄E) × ROE www.saltsolutions.com Copyright © 2021 Salt Solutions. All Rights Reserved. Personal copies permitted. Resale or distribution is prohibited. 15 Medium-Term Notes (MTNs) - Used to bridge gap between CP and L/T bonds - Offered to investors through an agent in a range of maturities - Lower registration/underwriting costs than bonds, but relatively illiquid USCP vs. Eurocommercial Paper Currency Maturity Interest calculation Settlement Negotiable USCP ECP US dollar Any currency Discount basis Interestbearing or discount basis Overnight to 270 days T+0 Can be sold Overnight to 364 days T+2 Can be sold Structured Financial Instruments - Guarantee certificate: Zero-coupon bond with a call option on the issuer’s equity - Credit-linked note: Seller earns a premium for providing credit protection on underlying bond - Participation Instruments: Coupon payments based on underlying rate (e.g., FRNs) - Leveraged Instruments: Modify returns Leveraged floater: 2 × (Reference rate) Deleveraged floater: 0.5 × (Reference rate) Leveraged inverse floater: Max coupon − 2 × (RR) Factors Increasing Repurchase (Repo) Rates - Higher Collateral risk - Longer term - Delivery requirement - Low quality collateral - Higher rates for alternative sources of funds INTRODUCTIONTO TOFIXED-INCOME FIXED-INCOMEVALUATION VALUATION INTRODUCTION Bond Pricing with Spot Rates PMT PMT + FV PMT + + ⋯+ PV = (1 + z! )! (1 + z4 )4 (1 + z< )< CR: Coupon Rate; MDR: Market Discount Rate CR = MDR CR < MDR CR > MDR Price = Par Value Par Price > Par Value Premium Price < Par Value Discount Bond Pricing Relationships - Inverse effect: Price moves opposite to yield - Convexity effect: Falling yield has greater price impact than equivalent increase in yield - Coupon effect: Yield changes have greater impact on lower coupon bonds - Maturity effect: Yield changes have greater impact on longer-term bonds (may not apply to lowcoupon bonds trading at very deep discounts) Flat Price, Accrued Interest, and Full Price PV \,YY = PV \Y$# + AI = (PV)(1 + r)#⁄2 AI = (t⁄T) × PMT www.saltsolutions.com Yield Measures Annual cash coupon payment Current yield = Flat price Annual cash Amortized + coupon payment gain/loss Simple yield = Flat price Yield-to-call (YTC) = IRR assuming bond is called Yield-to-worse = min[YTC, YTM] Yield Measures for FRNs Quoted margin (QM): Spread paid by FRN Discount margin (DM): Spread required by market If QM > DM, FRN will trade above par FRN pricing formula: (Ref + QM)(FV) (Ref + QM)(FV) + FV m m …+ = (Ref + DM) 4 (Ref + DM) ! \1 + ] ] \1 + m m Yield Measures for Money Market Instrument Discount Rate (DR) Basis Days PV = FV × \1 − × DR] Year Add-on Rate (AOR) Basis Days × AOR] PV = FV£\1 + Year Implied Forward Rate (IFR) (1 + z9 )9 × m1 + IFR 9,BA9n BA9 = (1 + zB )B Yield Spreads over Benchmark Yield Curve G-spread= YTM − Government bond yield I-spread= YTM − Swap rate Z-spread PMT PMT PMT + FV PV = + + ⋯+ (1 + z% + Z)% (1 + z& + Z)& (1 + z' + Z)' (Can only be calculated by trial-and-error) Option-adjusted spread (OAS) OAS = Z-spread − Option value (in basis points) INTRODUCTION TO INTRODUCTION TOASSET-BACKED ASSET-BACKED SECURITIES SECURITIES Parties to a Securitization - Seller/Depositor: Originates loans (assets) - Issuer: Special purpose vehicle (SPV) established to create asset-backed securities (ABS) - Servicer: Collects payments on underlying loans Securitization Example - Firm sells equipment on credit - Firm creates bankruptcy-remote SPV - SPV issues debt to purchase loans from firm - SPV creates securities backed by loans - Investors purchase securities from SPV - SPV collects loan payments from firm’s customers - SPV distributes cash flows to investors Residential Mortgage Loans - Interest: fixed, adjustable, convertible - Amortization: full, partial, interest-only - Prepayment: penalty, no penalty - Foreclosure: non-recourse, recourse Residential Mortgage-Backed Securities - Agency RMBS: Issued by government agencies; must have conforming loans - Non-agency RMBS: Issued by private companies and may have non-conforming loans - Pass-through rate: MBS coupon rate - Prepayment risk: Contraction (faster-thanexpected); extension (slower-than-expected) - Prepayment rates are relative to PSA benchmark Collateralized Mortgage Obligations (CMO) - Unlike pass-through securities, CMOs have tranches to redistribute cash flows and risks - Sequential-pay CMOs have principal and prepayments paid to the tranches sequentially - Planned amortization class (PAC) CMOs have support tranches to absorb prepayment risk Non-Mortgage ABS - Amortizing: E.g., auto loan ABS - Non-amortizing: E.g., credit card receivable ABS Collateralized Debt Obligations (CDO) Securities backed by pool of debt obligations, such as corporate bonds, leveraged bank loans, or credit default swap on securities Covered Bonds - Dual recourse against the issuing financial institution and the cover pool - One bond class per cover pool - Issuer must replace non-performing asset with performing asset ABS Tranching - Credit tranching: Certain tranches absorb credit losses before others - Absolute priority rule: Senior claims outrank subordinated claims in the event of a liquidation - Time tranching: Certain tranches are exposed to prepayment risk Copyright © 2021 Salt Solutions. All Rights Reserved. Personal copies permitted. Resale or distribution is prohibited. 16 UNDERSTANDINGFIXED-INCOME FIXED-INCOMERISK AND UNDERSTANDING RETURNS RISK AND RETURNS Constant Yield Price Trajectory Convexity (PVA ) + (PVL) − [2 × (PVQ)] ApproxCon = (ΔYield)< (PVQ) 1 %ΔPV \,YY = −D1)& × ΔYTM + (Conv)(ΔYTM)< 2 (PVA ) + (PVL ) − 2(PVQ ) EffConv = (ΔCurve)<(PVQ ) DERIVATIVES DERIVATIVES DERIVATIVE DERIVATIVEINSTRUMENT INSTRUMENTAND ANDDERIVATIVE DERIVATIVE MARKET MARKET FEATURES FEATURES Derivative Underlyings - Equities - Fixed-income instruments and interest rates - Currencies - Commodities - Credit - Other (e.g., weather, crypto, longevity risk) Derivatives Markets Yield Duration vs. Curve Duration Yield duration: Sensitivity to YTM Measures: Macaulay duration, modified duration, money duration, price value of basis point (PVBP) Curve duration: Sensitivity to benchmark yields (e.g., effective duration); for bonds with options Macaulay Duration 1+r 1 + r + N(c − r) t − ]− D1$( = \ r c[(1 + r)! − 1] + r T r: YTM c: Coupon rate N: Number of periods to maturity t: Number of days since last coupon payment T: Number of days in each coupon period Modified Duration D1$( ModDur = 1+r %ΔPV \,YY = −AnnModDur × ΔYield (PVA ) − (PVL ) ApproxModDur = 2(ΔYield)(PVQ ) Money Duration and PVBP MoneyDur = AnnModDur × PV \,YY ΔPV \,YY ≈ −MoneyDur × ΔYield (PVA ) − (PVL ) Price value of a basis point = 2 Basis point value = D1)& × 0.0001 Effective Duration (PVA ) − (PVL ) EffDur = 2(ΔCurve)(PVQ ) www.saltsolutions.com Liquidity Trading costs Duration Gap Duration gap = D1$( − Investment horizon - If positive: Price risk > Reinvestment risk - If negative: Reinvestment risk > Price risk FUNDAMENTALS OFCREDIT CREDITANALYSIS ANALYSIS FUNDAMENTALS OF Credit Risk - Default risk: Probability of default - Loss severity: Loss given default E[Loss] = Pr(Default) × Loss severity Loss severity = 1 − Recovery rate Spread Risk - Credit migration risk: Possibility of downgrade - Market liquidity risk: Need to sell at a discount Seniority Ranking - First Lien Loan – Senior Secured - Second Lien Loan – Secured - Senior Unsecured - Senior Subordinated - Subordinated - Junior Subordinated Pari passu: All creditors in the same ranking, regardless of maturity, have the same priority Credit Ratings Investment grade: Baa3/BBB- and above Non-investment grade: Ba1/BB+ and below Four C’s of Credit Analysis - Capacity - Collateral - Covenants - Character Corporate Bond Yield Components - Real risk-free interest rate - Expected inflation rate - Maturity premium - Liquidity premium Yield spread - Credit spread Transparency Standardization Flexibility/ customization Counterparty credit risk OTC Market ETD Market Less Greater Higher Lower Lower Higher Lower Higher Higher Lower Higher Lower FORWARD FORWARD COMMITMENT COMMITMENT AND AND CONTINGENT CONTINGENT CLAIM FEATURES AND AND INSTRUMENTS INSTRUMENTS Types of Derivatives Forward commitments: Obligation to trade on a specified date at a previously agreed price Contingent claims: Trade may or may not occur depending on market conditions Forward Commitments Forward contract Futures contracts Swaps Contingent Claims Options Credit derivatives DERIVATIVE ISSUER DERIVATIVEBENEFITS, BENEFITS, RISKS, RISKS, AND ISSUER AND INVESTOR USES USES Derivative Benefits and Risks Benefits: - Risk allocation, transfer, and management - Information discovery - Operational advantages - Market efficiency Risks: - Potential for speculative use - Lack of transparency - Basis risk - Liquidity risk - Counterparty credit risk - Destabilization and systemic risk Derivative Benefits and Risks Issuers use derivatives to perform: - Cash flow hedge - Fair value hedge - Net investment hedge Copyright © 2021 Salt Solutions. All Rights Reserved. Personal copies permitted. Resale or distribution is prohibited. 17 Investors use derivatives to hedge their risk exposures and take speculative positions ARBITRAGE, COSTOF OF ARBITRAGE, REPLICATION, REPLICATION, AND AND THE THE COST CARRY CARRY IN IN PRICING PRICING DERIVATIVES DERIVATIVES No-Arbitrage Forward Price with Benefits/Income and Costs Annual compounding: FQ (T) = [SQ + PVQ (C) − PVQ (I)](1 + r)2 Continuous compounding: FQ (T) = SQ e(-L(A+)6 No-Arbitrage Currency Forward Price FQ,W/& (T) = SQ,W/& e(-3A-%)6 PRICING AND VALUATION VALUATION OF OF FORWARD PRICING FORWARD CONTRACTS CONTRACTS Pricing and Valuation of Forward Commitments Valuation at initiation: FQ (T) = SQ (1 + r)2 Valuation at maturity: - Long party: V2(T) = S2 − FQ (T) - Short party: V2(T) = −[S2 − FQ (T)] Pricing and Valuation of Currency Forward Contracts Valuation at initiation: FQ,W/& (T) = SQ,W/& e(-3A-%)6 Valuation during the life of the contract: V# (T) = S#,W/& − FQ,W/& (T)eA(-3A-%)(2A#) Pricing and Valuation of Interest Rate Forward Contracts Implied forward rate: 4/(BA9) Forward rate agreements: −1 Call Put Value of underlying ↑ ↓ Risk-free rate ↑ ↓ Exercise price Time to expiration Volatility of underlying Payments on underlying Cost of carry Type Interest rate futures Gains from Rising MRR Gains from Falling MRR Short futures contract Long futures contract Long FRA: Fixed-rate payer Forward rate agreement Futures Contract Value = Notional Principal × †1 + \ Short FRA: Floating-rate payer MRR ]° M Forward Price vs. Futures Price The relationship between forward prices and futures prices depends on the correlation between futures prices and interest rates: Correlation None Positive Negative Relationship Futures price = Forward price Futures price > Forward price Futures price < Forward price PRICING AND AND VALUATION VALUATIONOF OF INTEREST INTEREST RATES PRICING AND ANDOTHER OTHERSWAPS SWAPS Swap Values and Prices Periodic settlements: Periodic Settlement Value = Notional Principal × 0.0001 × Period Option Moneyness Option Moneyness Out-of-the-money Option Values c2 = max[0, S2 − X] p2 = max[0, X − S2] Call Put S# > X S# < X S# = X S# < X S# = X S# > X c# = max[0, S# − X⁄(1 + r)2A# ] + Time value p# = max[0, X⁄(1 + r)2A# − S# ] + Time value Arbitrage and Replication for Options Call option: - Lower bound (c# ) = max[0, S# − X/(1 + r)2A# ] - Upper bound (c# ) = S# Put option: - Lower bound (p# ) = max[0, X/(1 + r)2A# − 𝑆𝑆7 ] - Upper bound (c# ) = X ↓ ↑ ↑ ↓ ↑ ↑ ↑* ↑ ↑ ↓ *Except for some deep-in-the-money put options OPTION PUT-CALLPARITY PARITY OPTION REPLICATION REPLICATION USING USING PUT-CALL Put-Call Parity cQ + X⁄(1 + r)2 = sQ + pQ Fiduciary call = Protective put Put-Call-Forward Parity cQ + X⁄(1 + r)2 = FQ(T)⁄(1 + r)2 + pQ Fiduciary call = Protective put w. forward contract Put-Call Parity Applications: Firm Value VQ + pQ = cQ + PV(D) VALUINGAADERIVATIVE DERIVATIVEUSING USINGAAONE-PERIOD ONE-PERIOD VALUING BINOMIAL BINOMIALMODEL MODEL Binomial Valuation Hedging portfolio: VQ = hSQ − cQ Hedge ratio: h= c4, − c4& S4, − S4& Risk Neutrality Risk-neutral probabilities: 1+r−d π= u−d Risk-neutral probability-weighted call price: cQ = PRICING PRICING AND AND VALUATION VALUATIONOF OF OPTIONS OPTIONS At-the-money www.saltsolutions.com Increase in f9,BA9 = 100 − m100 × MRR 9,BA9 n In-the-money Net payment received by the FRA buyer: (MRR − Fixed IFR) × Notional principal × Period Factors Impacting Option Values Pricing of Futures and Forward Contracts Price of interest rate futures contract: Futures Contract BPV = Notional Principal × 0.0001 × Period Valuation during the life of the contract: V# (T) = S# − FQ (T)(1 + r)A(2A#) (1 + zB )B ä IFR 9,BA9 = â (1 + z9 )9 PRICING PRICING AND AND VALUATION VALUATIONOF OF FUTURES FUTURE CONTRACTS CONTRACTS πc4, + (1 − π)c4& 1+r ALTERNATIVE INVESTMENTS ALTERNATIVE INVESTMENTS CATEGORIES, CHARACTERISTICS, CHARACTERISTICS, AND CATEGORIES, AND COMPENSATION OF COMPENSATION STRUCTURES STRUCTURES OF ALTERNATIVE ALTERNATIVEINVESTMENTS INVESTMENTS Qualities of Alternatives vs. Traditional Assets - Narrow manager specialization - Low correlation with traditional investments - Less regulation and lower transparency - Limited historical risk and return data - Unique legal and tax considerations - High fees - High use of leverage - Restrictions on redemptions Investment Methods - Fund Investing: Indirect investing - Co-Investing: Hybrid between direct investing and indirect investing - Direct investing: Without the use of intermediary Copyright © 2021 Salt Solutions. All Rights Reserved. Personal copies permitted. Resale or distribution is prohibited. 18 Compensation Structures - Soft hurdle rate: Incentive fee applies to entire return if hurdle rate is cleared - Hard hurdle rate: Incentive fee is only paid on return in excess of hurdle rate Common Clauses and Provisions - Catch-up clause: Allows the GP to receive 100% of the return in excess of the hurdle rate until the GP catches up with their cumulative performance fee - High-water mark clause: Reflects the highest value used to calculate an incentive fee - Waterfall: Distribution method that defines the order of allocations to the LPs and GPs - Clawback provision: Allows the LPs to get back incentive fees that have been paid if gains are subsequently reversed PERFORMANCECALCULATION CALCULATIONAND ANDAPPRAISAL PERFORMANCE APPRAISAL OF ALTERNATIVE INVESTMENTS OF ALTERNATIVE INVESTMENTS Common Approaches and Application Challenges r . − rW Sharpe ratio = 𝜎𝜎g - Easy to calculate - Fails to capture tail-risk and treat volatility equally r. − rW Sortino ratio = 𝜎𝜎h - Does not penalize upside volatility - More difficult to calculate than Sharpe ratio, but is more appropriate with non-normal returns Average compounded annual return (since inception) MAR ratio = Max. drawdown (since inception) Average compounded annual return (period) Calmar ratio = Max. drawdown (period) - Appropriate for assets with long left-tail distributions Performance Evaluation: Private Equity and Real Estate - Internal rate of return (IRR) - Multiple of invested capital (MOIC) Realized value Unrealized value + of investment = of investment Total amount of investment - Quartile ranking - Cap rate Performance Evaluation: Hedge Funds - Leverage - Illiquidity and asset valuations - Potential redemption pressures (notice periods, lockup periods, liquidity gates) www.saltsolutions.com PRIVATE CAPITAL, CAPITAL, REAL REAL ESTATE, ESTATE, PRIVATE INFRASTRUCTURE,NATURAL NATURALRESOURCES, RESOURCES, INFRASTRUCTURE, AND HEDGE FUNDSFUNDS AND HEDGE Private Equity: Leveraged Buyouts - Management buyouts: Current management team is involved in the acquisition - Management buy-ins: Current management team is being replaced by the acquiring team Private Equity: Venture capital - Formative-stage financing: Angel investing, seed-stage financing, early-stage financing - Later-stage financing: After commercial production and sales have begun but before IPO - Mezzanine-stage financing: Prepare to go public Exit strategies: Trade sale (best price), IPO, recapitalization, secondary sale, liquidation Private Debt - Direct lending: Direct capital in the form of senior and secured loans - Mezzanine debt: Debt subordinated to senior secured debt but senior to equity - Venture debt: To complement existing equity financing of start-up or early-stage companies - Distressed debt: Funding provided to mature companies facing financial distress Forms of Real Estate Investing Private Public Debt Mortgages, Construction lending MBS, CMOs, Mortgage REITs Equity Direct ownership, Real estate funds, Private REITs Shares in RE corps., REITs Infrastructure Investments - New (greenfield) or existing (brownfield) assets - Economic (roads) or social (healthcare facilities) - Direct ownership or indirect (via LP or ETF) - Private vehicles or public securities (uncommon) Commodities Futures price: SQ (1 + r) + Storage costs – Convenience yield Contango Price curve slope Convenience yield Upward Low Timberland and Farmland Sources of return: - Biological growth - Prices of timber/crops - Land price changes Backwardation Downward High Hedge Fund Strategies - Equity hedge: Long and short positions in equity and equity derivative securities; Bottom-up - Event-driven: Seek to profit from short-term events (e.g., Mergers); Bottom-up - Relative value: Seek to profit from pricing discrepancies between related securities - Macro: Emphasize top-down approach to identifying global economic trends PORTFOLIO MANAGEMENT PORTFOLIO MANAGEMENT PORTFOLIOMANAGEMENT: MANAGEMENT:AN ANOVERVIEW OVERVIEW PORTFOLIO Portfolio Management Process Planning: List objectives and constraints in IPS Execution: Asset allocation, security analysis, portfolio construction Feedback: Monitoring and rebalancing, performance measurement and reporting Institutional Investor Clients - DB pension plans: Younger beneficiaries increase time horizon and risk tolerance - Endowments/Foundations: Generally longer time horizon, low liquidity needs, high risk tolerance - Banks: Short time horizon, high liquidity need, very low risk tolerance - Insurers: Short time horizon (longer for Life than P&C), high liquidity needs, low risk tolerance - Investment companies: Time horizon and risk tolerance vary by mandate, liquidity needs are usually high due to potential redemptions - Sovereign Wealth Funds: Vary by mandate Robo-Advisors - Cater to underserviced segments, “mass affluent” - Lower fees compared to traditional managers - Relatively low barriers to entry Mutual Funds - Open-end: Accept new investors after launch - Closed-end: No new shares created after launch, may trade at a premium/discount to NAV - No-Load: No investing/redemption fees, funds charge a percentage of NAV Exchange Traded Funds (ETFs) - Mutual funds only trade at the end of each day, ETFs can be traded at any time during the day - Investors can sell ETFs short or buy on margin - ETFs do not trade at discount/premium to NAV - ETFs distribute dividends to investors, mutual funds reinvest dividends - ETFs have lower minimum investment levels PORTFOLIORISK RISKAND ANDRETURN: RETURN:PART PARTI I PORTFOLIO Money-Weighted Return (MWR) - IRR derived from all cash inflows and returns - Can be skewed by timing/value of cash flows - Appropriate if manager controls timing of CFs Time-Weighted Return (TWR) - Geometric mean of sub-period returns - Compound growth for an initial $1 investment - Unaffected by timing/value of cash flows Copyright © 2021 Salt Solutions. All Rights Reserved. Personal copies permitted. Resale or distribution is prohibited. 19 Capital Market Line (CML) CAL with risky portfolio being market portfolio E[R ' ] − R W à σ. E•R . ¶ = R W + á σ' Borrowing vs. Lending Identifying Mispriced Stocks Stocks that plot above the SML are underpriced; stocks that plot below the SML are overpriced Ratios Total risk Utility Function 1 U = E(r) − Aσ< 2 A is the degree of risk aversion, it is >0 for riskaverse, 0 for risk-neutral, and <0 for risk-seeking PORTFOLIORISK RISKAND ANDRETURN: RETURN:PART PARTIIII PORTFOLIO Sharpe ratio Msquared Treynor ratio Systematic risk Risk Aversion Combination of ability and willingness to take risk Risk averse: Requires a premium to take more risk Risk neutral: Only concerned with expected return, indifferent to level of risk Risk seeking: Will pay a premium to take more risk Jensen’s alpha Indifference Curves R. − RW σ. σ' mR . − R W n + RW σ. R. − RW β. R . − •R W + β. (R ' − R W )¶ BASICSOF OFPORTFOLIO PORTFOLIOPLANNING PLANNING BASICS AND AND CONSTRUCTION CONSTRUCTION Investment Policy Statements (IPS) Investment objectives: Risk/return objectives Constraints: Liquidity, time horizon, tax concerns, legal and regulatory factors, unique circumstances Beta Minimum-Variance Portfolios Capital Allocation Line (CAL) Line representing possible combinations of riskfree assets and optimal risky asset portfolio E[R + ] − R W à σ. E•R . ¶ = R W + á σ+ Investor’s Optimal Portfolio Cov(R + , R ' ) ρ+,' σ+ = σ' σ<' Systematic risk = Non-diversifiable (market) risk Nonsystematic risk = Diversifiable risk Total risk = Systematic risk + Nonsystematic risk β+ = Capital Asset Pricing Model (CAPM) Assumptions: - Investors are risk-averse, utility-maximizing, rational individuals - Markets are frictionless - All investors plan for same single holding period - Investors have homogeneous expectations - Investments are infinitely divisible - Investors are price takers E•R . ¶ = R W + β+ [E[R ' ] − R W ] Limitations: - Single-factor: Only accounts for systematic risk - Single-period: Does not consider multiple periods - Inclusion of assets that are not investable, such as human capital and assets in closed economies Security Market Line (SML) Graphical representation of CAPM: www.saltsolutions.com Asset Allocation Strategic asset allocation: Set of exposures to IPSpermissible asset classes in weights that are consistent with the client’s long-term objectives Tactical asset allocation: Deliberate deviations from policy weights based on forecasts of asset class returns over the near term THE BEHAVIORAL BEHAVIORAL BIASES BIASESOF OFINDIVIDUALS INDIVIDUALS THE Cognitive Errors - Conservatism bias: People fail to incorporate new information that conflicts with their opinions - Confirmation bias: People seek “evidence” that confirms their prior beliefs - Representativeness bias: People inappropriately classify new information based on past similar situations - Illusion of control bias: People overestimate their ability to control or predict events - Hindsight bias: People believe past events would have been predictable - Anchoring and adjustment bias: People rely too much on initial information in their estimation - Mental accounting bias: People put money in separate mental buckets - Framing bias: People answer the same question differently based on how it is framed - Availability bias: People assume outcomes that are easier to remember are more likely Copyright © 2021 Salt Solutions. All Rights Reserved. Personal copies permitted. Resale or distribution is prohibited. 20 Emotional Biases - Loss-aversion bias: People strongly prefer avoiding losses more than achieving gains - Overconfidence bias: People overestimate their own abilities - Self-control bias: People lack self-discipline to make decisions based on their long-term goals - Status quo bias: People are more inclined to do nothing rather than make changes - Endowment bias: People value an asset more when they hold the rights to it - Regret-aversion bias: People avoid making decisions that could potentially turn out badly Bar chart ANINTRODUCTION INTRODUCTIONTO TORISK RISKMANAGEMENT MANAGEMENT AN Trends Uptrend: Price reaches higher highs/lows Downtrend: Price reaches lower highs/lows Support: Buying is sufficient to stop further decline Resistance: Selling pressure stops further increase Market Anomalies Factors that cause anomalies misclassifications: - Inappropriate asset pricing model - Statistical issues due to small samples - Temporary disequilibria Risk Management Risk management framework: - Risk governance - Risk identification and measurement - Risk infrastructure - Defined policies and processes - Risk monitoring, mitigation, and management - Communications - Strategic analysis or integration Risk tolerance: Which risks are acceptable and how much risk should be taken Risk budgeting: How the risks should be taken Financial risks: Arise from financial market activities (e.g., market, credit, liquidity risk) Non-financial risks: Arise from within entity or from external (e.g., operational, legal, regulatory, political, model, tail risk) Risk measures: Standard deviation, beta, duration, delta, gamma, VaR, CVaR, etc. Risk modification: By prevention and avoidance, transfer (insurance), or shifting (derivatives) TECHNICALANALYSIS ANALYSIS TECHNICAL Technical Analysis: Principles - The market discounts everything - Prices move in trends and countertrends - Price action is repetitive with reoccurring patterns Technical Analysis: Charts Line chart: A plot of price data, typically closing prices, with a line connecting the points www.saltsolutions.com Triangle (Symmetrical) Narrowing = bullish; Widening = bearish Candlestick chart White body: close > open; Dark body: close < open Reversal Patterns Head and shoulders (H&S): Indicate an upcoming downtrend following a preceding uptrend Inverse H&S: Indicate an upcoming uptrend following a preceding downtrend Rectangles (Bullish and Bearish) Flag: Parallel trend lines over short period Pennant: Converging trend lines over short period Price-Based Indicators Moving average (MA): Average closing price over a specified number of periods (e.g., 7-day, 60-day) Golden cross: Short-term MA crosses long-term MA from below; bullish indicator Dead cross: Short-term MA crosses long-term MA from above; bearish indicator Bollinger bands: Lines representing MA +/ − X standard deviations; Bullish if MA reaches lower bound, bearish if MA reaches upper bound Price target = Neckline − (Head − Neckline) Double tops: When an uptrend reverses twice at about the same high Price target = Valley − (Top − Valley) Double bottoms: When a downtrend reverses twice at about the same low Price target = Top + (Top − Valley) Triple Tops/Bottoms: More significant indicators than double tops/bottoms Continuation Patterns Triangles (Ascending and Descending) Copyright © 2021 Salt Solutions. All Rights Reserved. Personal copies permitted. Resale or distribution is prohibited. 21 Momentum Oscillators Rate of Change (ROC) Oscillator: M = (V − Vx) × 100 V = last closing price Vx = closing price x days ago, typically 10 ROC oscillator crossing 0 in the same direction as the trend direction is buy/sell signal Relative Strength Index: Σ(Up changes) 100 , RS = RSI = 100 − Σ(|Down changes|) 1 + RS Stochastic Oscillator: Last closing price − Low in past 14 ] %K = 100 \ High in past 14 − Low in past 14 %D = average of last 3 daily %K values MA convergence/divergence (MACD) oscillator: Consists of MACD line and signal line: MACD line is the difference between two exponentially smoothed moving averages (12 and 26 days); Signal line is the exponentially smoothed average of MACD line (9 days) Sentiment Indicators Put/call ratio: Volume of put options traded divided by volume of call options traded CBOE Volatility Index (VIX): Measures near-term market volatility calculated by the CBOE Intermarket Analysis The combined analysis of major categories of securities (equities, bonds, etc.) to identify patterns and inflection points - Top-down approach: Focus on global equity markets, then narrow down to specific companies - Bottom-up approach: Select stocks based on a set of predefined criteria regardless of economy and sector FINTECHIN ININVESTMENT INVESTMENTMANAGEMENT MANAGEMENT FINTECH Machine Learning Supervised learning: Algorithm finds relationships among labeled training data Unsupervised learning: Algorithm works with unlabeled data to create clusters/groupings Data Processing Methods Data capture: Collecting data, transforming into usable format Data curation: Cleaning data to ensure high quality Data storage: Recording, archiving, accessing data Search: Finding specific information in datasets Transfer: Moving data from source or storage location to the analytical tool Uses of Fintech in Investment Management Text Analytics: Analysis of unstructured data Natural Language Processing: Interpreting human language (e.g., speech recognition) Distributed Ledger Technology (DTL) Ownership of assets is created and exchanged on a peer-to-peer network Smart contracts: Programmed to execute if specified conditions are met www.saltsolutions.com Blockchain: Digital ledger for blocks of linked transactions validated through user consensus Permissionless networks: No centralized authority needed to validate transactions Permissioned networks: Members are restricted from participating in certain activities Uses of DTL in Investment Management Cryptocurrencies: Allow transactions without intermediaries, such as banks Tokenization: Represents ownership of physical assets on a blockchain or distributed ledger Clearing/Settlement: DTL allows near real-time trade verification and reconciliation Compliance: Allows regulators to conduct near real-time review of all transactions ETHICAL STANDARDS ETHICALAND ANDPROFESSIONAL PROFESSIONAL STANDARDS I(A) Knowledge of the Law Obey strictest applicable law. Disassociate immediately from any illegal or unethical activity. I(B) Independence and Objectivity Do not offer or accept gifts that might impair independence and objectivity. Gifts from clients may be permissible. I(C) Misrepresentation Cite sources. Do not plagiarize or omit important information. Act quickly to correct any errors. I(D) Misconduct Does not apply to personal behavior unless it reflects poorly on the investment profession. II(A) Material Nonpublic Information Do not act or cause others to act on material nonpublic information. Seek public dissemination. II(B) Market Manipulation Do not take any actions that distort prices or trading volume. Market making and legitimate trading strategies are allowed. III(A) Loyalty, Prudence, and Care Place clients’ interest above yours. Disclose policies on proxy voting and soft commissions. III(B) Fair Dealing Treat all clients fairly. Treat non-immediate family like other clients. Communicate investment recommendations and changes simultaneously. IV(A) Loyalty Get permission before taking outside work (even unpaid) that competes with employer. Abide by non-compete agreement (if applicable) and do not take employer’s property. IV(B) Additional Compensation Arrangements Obtain written permission from all parties before receiving any compensation for outside work. IV(C) Responsibilities of Supervisors Supervisors must adequately train and monitor subordinates. Responsibilities may be delegated. V(A) Diligence and Reasonable Basis Exercise diligence and thoroughness. Support actions with research and investigation. V(B) Communication with Clients and Prospective Clients Make appropriate disclosures. Distinguish between fact and opinion in analysis and recommendations. V(C) Record Retention Maintain records to support recommendations and decisions. 7-year retention period recommended. VI(A) Disclosure of Conflicts Disclose any matters that may impair independence and objectivity, prominently and in plain language. VI(B) Priority of Transactions Execute clients’ transactions before accounts in which you have a beneficial interest. VI(C) Referral Fees Disclose referral fees to clients and employer, including non-monetary arrangements. VII(A) Conduct as Participants in CFA Institute Program Do not share confidential exam details. Expressing opinions about CFAI policies is permissible. VII(B) Reference to CFA Institute, the CFA Designation, and the CFA Program Do not misrepresent the meaning of CFA Institute membership, designation, or candidacy. III(C) Suitability Use a regularly updated IPS during investment decisions. Evaluate decisions in a portfolio context. III(D) Performance Presentation Performance data should be fair, accurate, and complete. Do not promise returns for risky assets. III(E) Preservation of Confidentiality Keep all client information confidential unless: client is involved in illegal activity, you are legally required, or you have the client’s permission. Copyright © 2021 Salt Solutions. All Rights Reserved. Personal copies permitted. Resale or distribution is prohibited. 22 BA II PLUS TIPS BA CALCULATOR II PLUS CALCULATOR TIPS Basic Operations 2ND : Access secondary functions (in yellow) ENTER : Send value to a variable 2ND + ENTER : Toggle between options ↑ ↓ : Navigate between variables/options STO + 0 - 9 : Store current value into memory RCL + 0 - 9 : Recall value from memory Time Value of Money (TVM) For annuity, loan, and bond calculations N : Number of periods I/Y : Effective interest rate per period (in %) PV : Present value PMT : Payment/coupon amount FV : Future value/redemption value CPT + one of the above : Solve for unknown 2ND + BGN : Toggle between ordinary annuity and annuity due 2ND + CLR TVM : Clear TVM worksheet Note: - Always clear the TVM worksheet before starting a new calculation - For bonds, PMT and FV should have the same sign, and opposite signs to PV Cash Flow Worksheet ( CF , NPV , IRR ) For non-level payments Input ( CF ) CF0: Initial cash flow C01: 1st distinct cash flow after initial cash flow F01: Frequency of CO1 C0n: nth distinct cash flow F0n: Frequency of C0n Note: - Always clear the CF worksheet before starting a new calculation - The use of F0n is optional. You can leave them as 1 and input repeating cash flows multiple times. If you do so, C01 will be the cash flow at time 1, C02 will be the cash flow at time 2, and so on. Output ( NPV , IRR ) I: Effective interest rate per period (in %) NPV + CPT : Solve for net present value IRR + CPT : Solve for internal rate of return www.saltsolutions.com Copyright © 2021 Salt Solutions. All Rights Reserved. Personal copies permitted. Resale or distribution is prohibited. 23
Related Documents
CFA 1 Formula Sheet – 2023 Syllabus
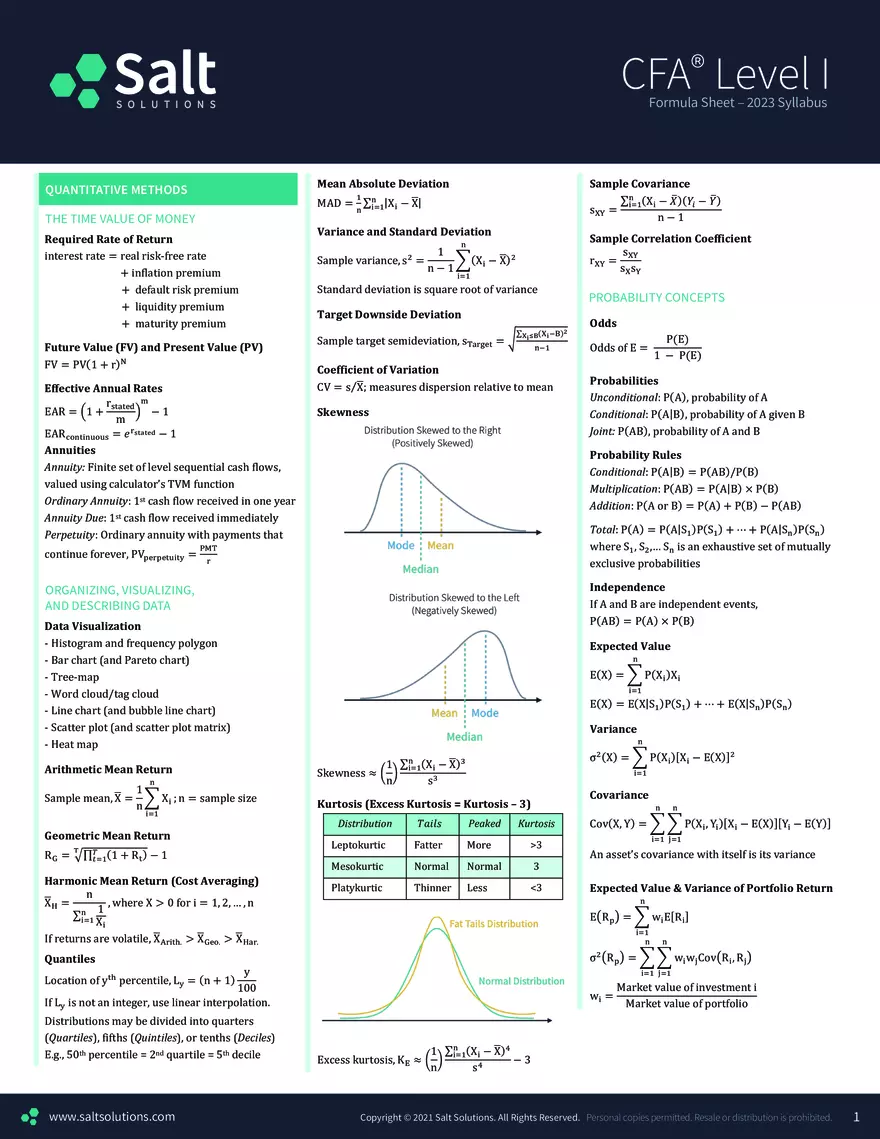
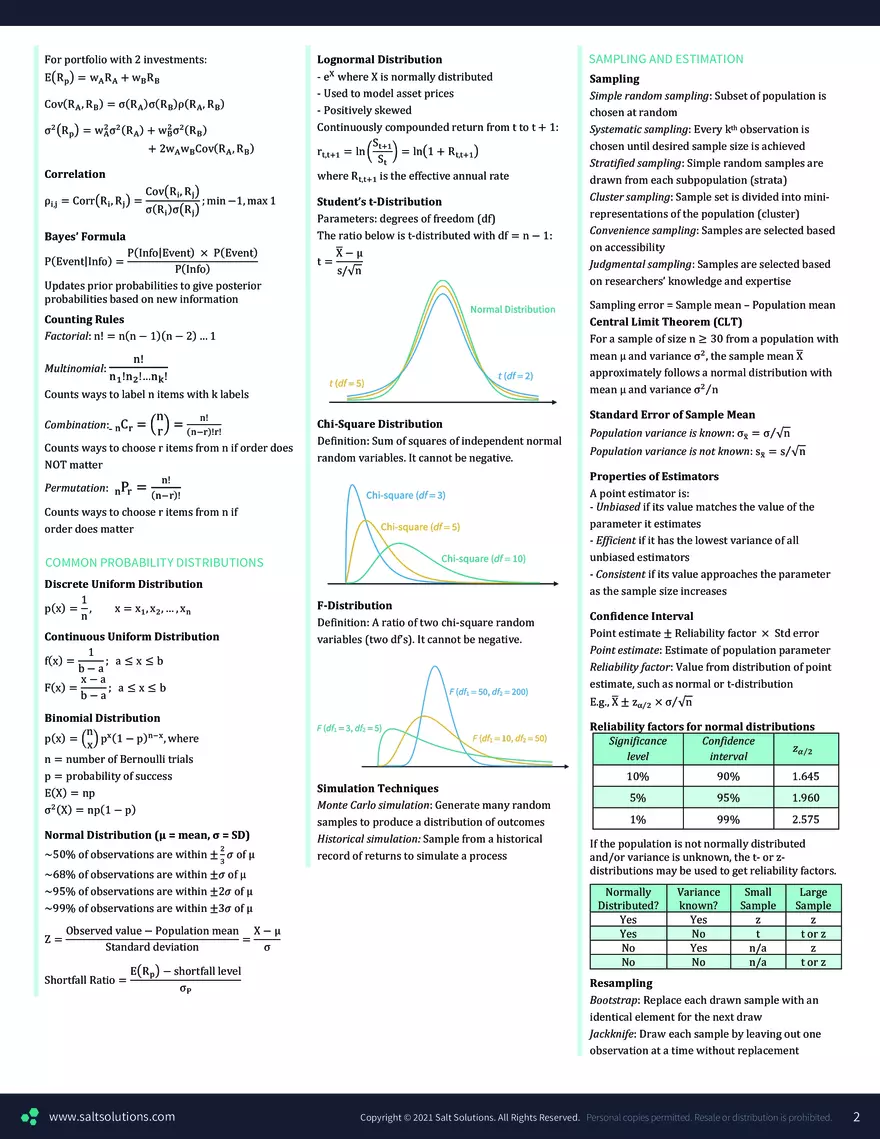
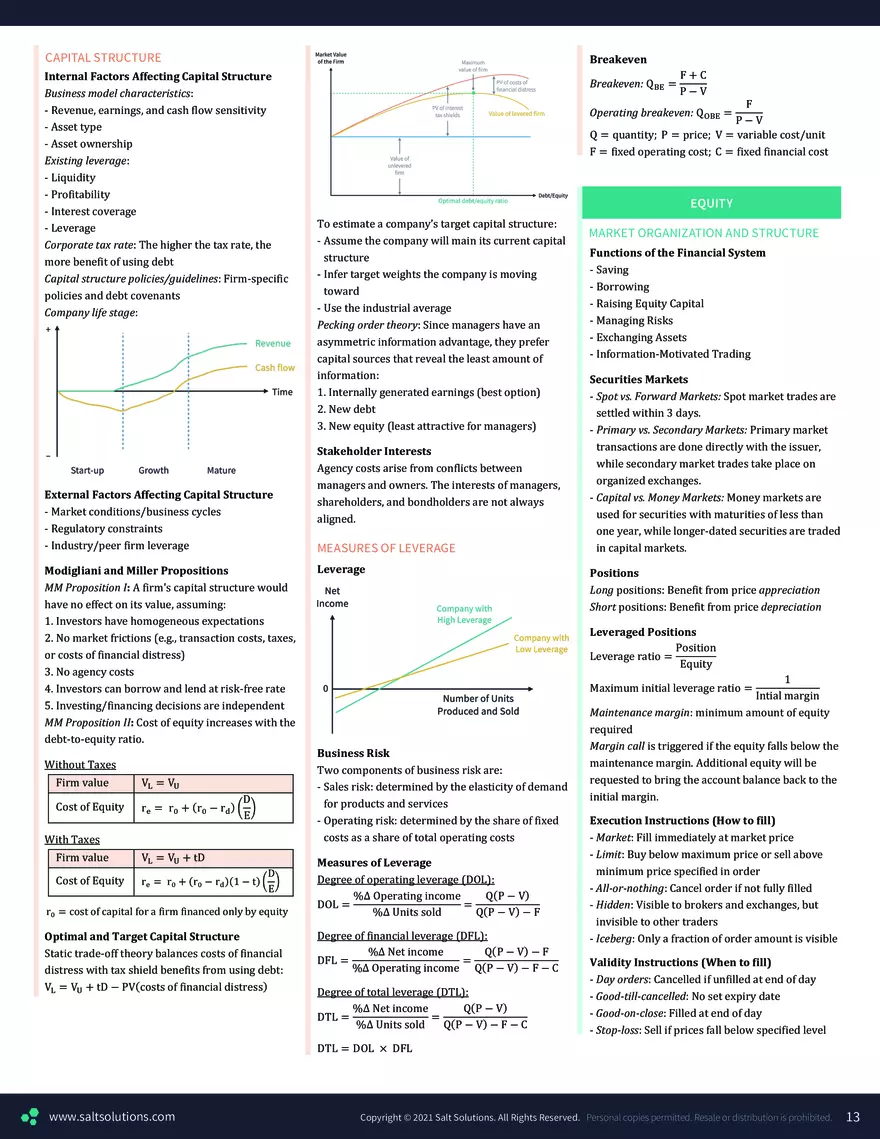
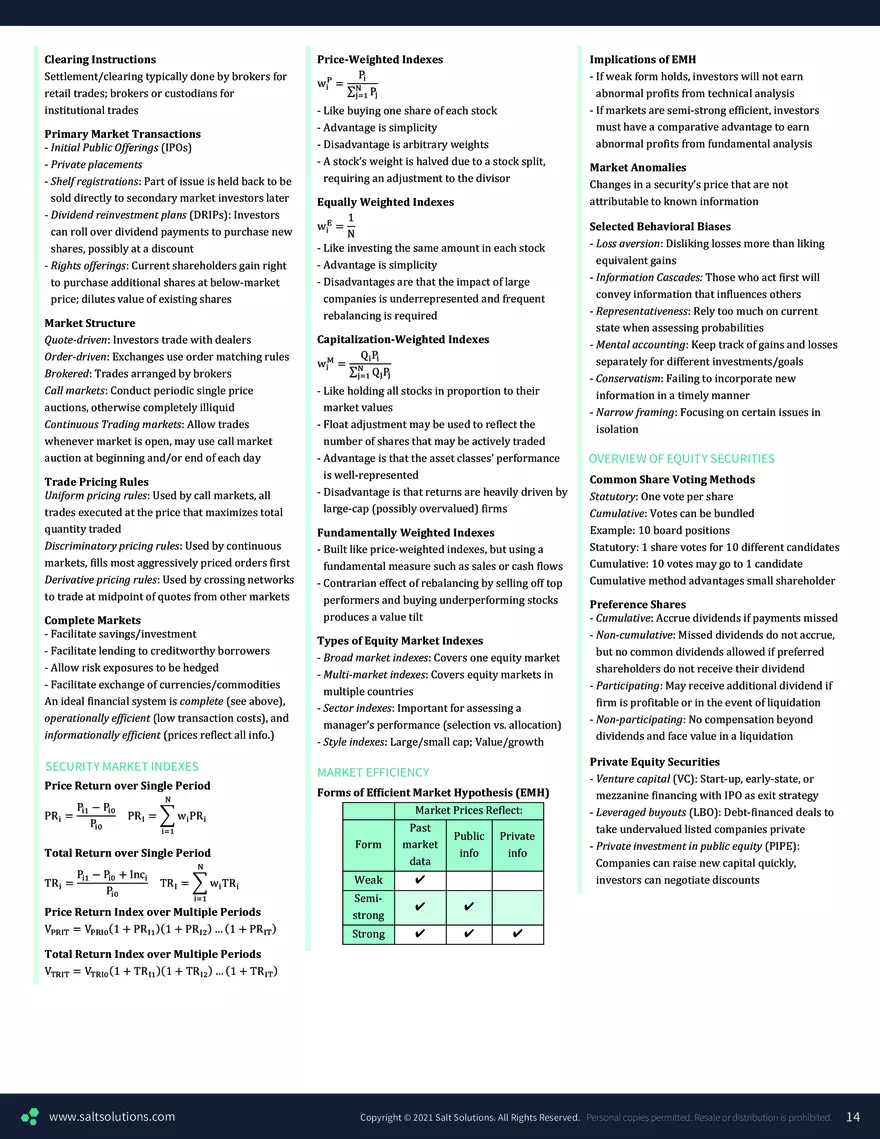
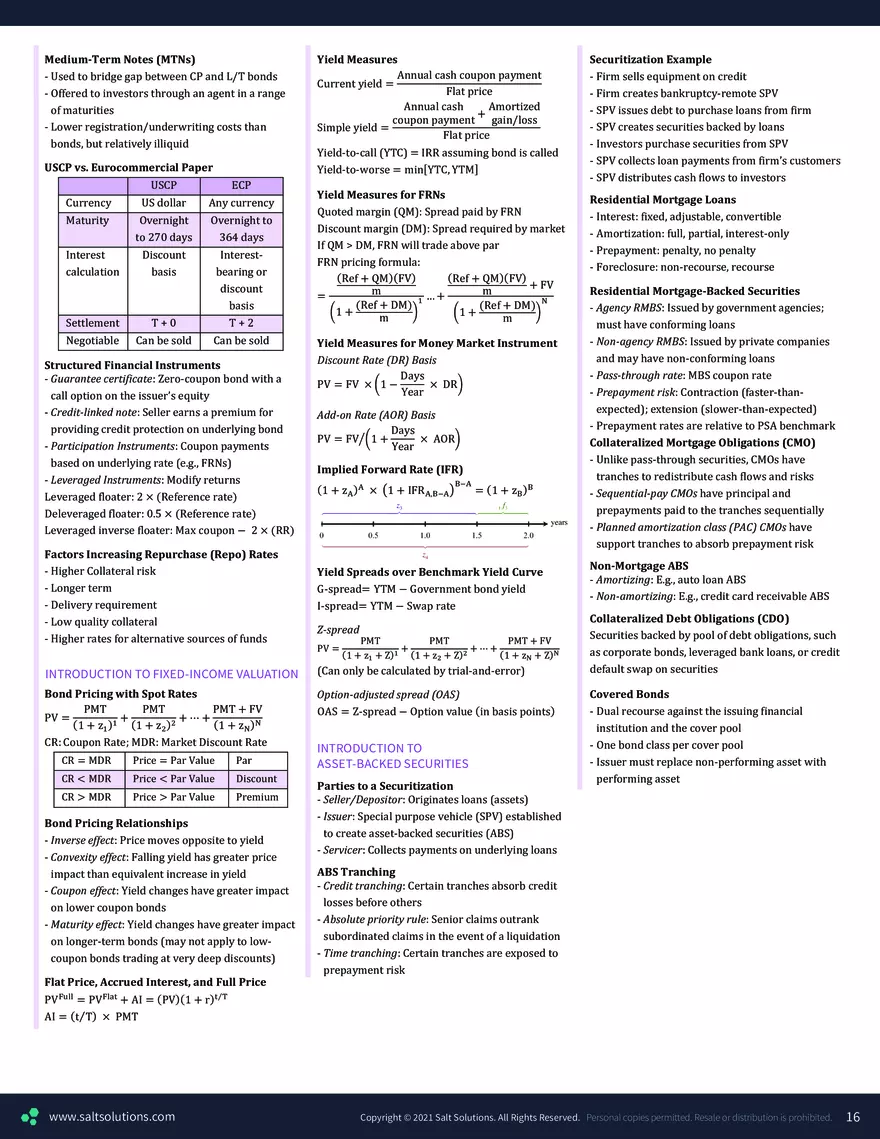
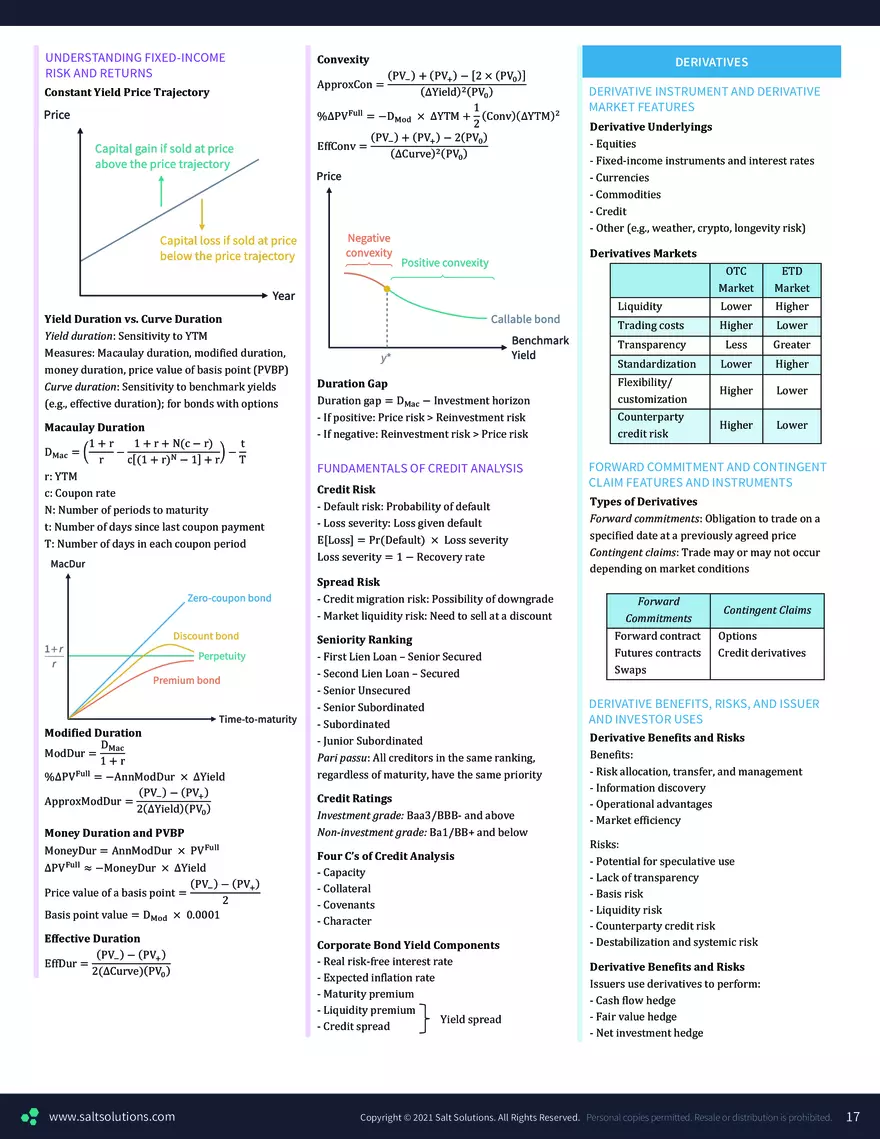
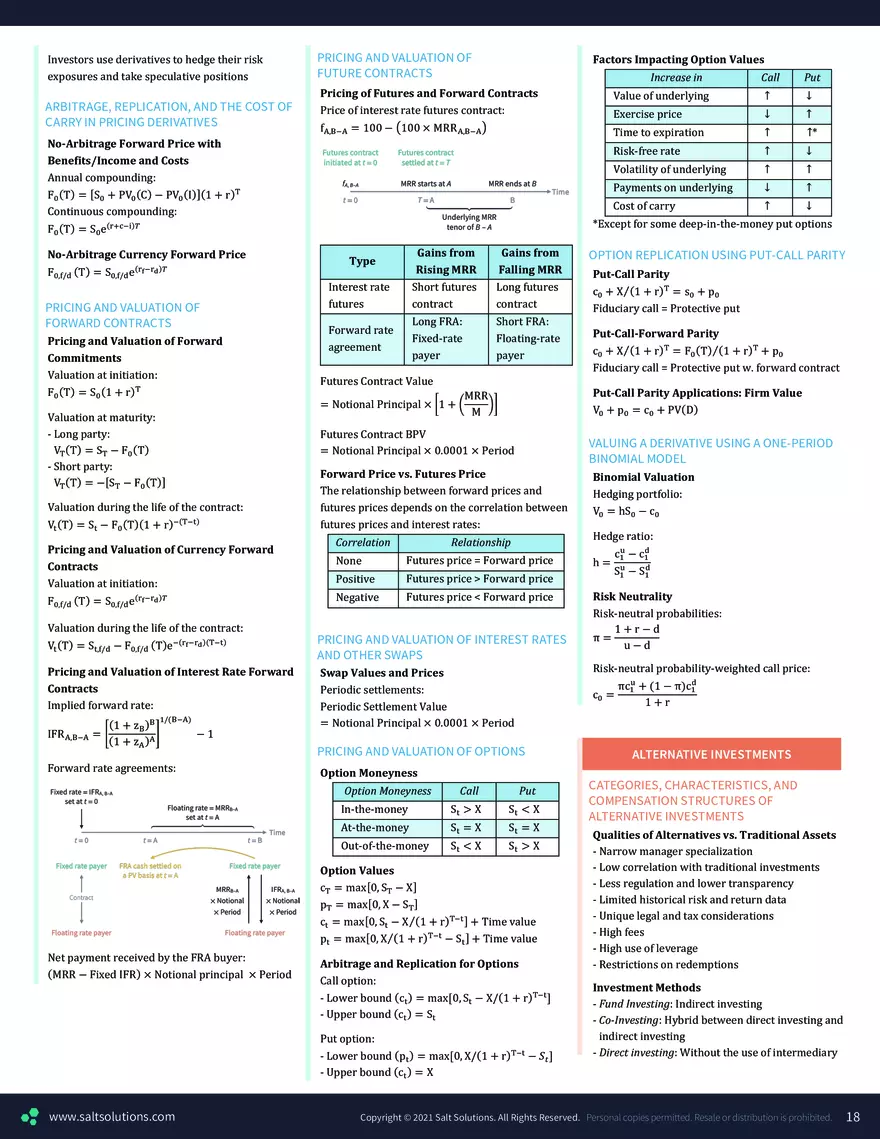
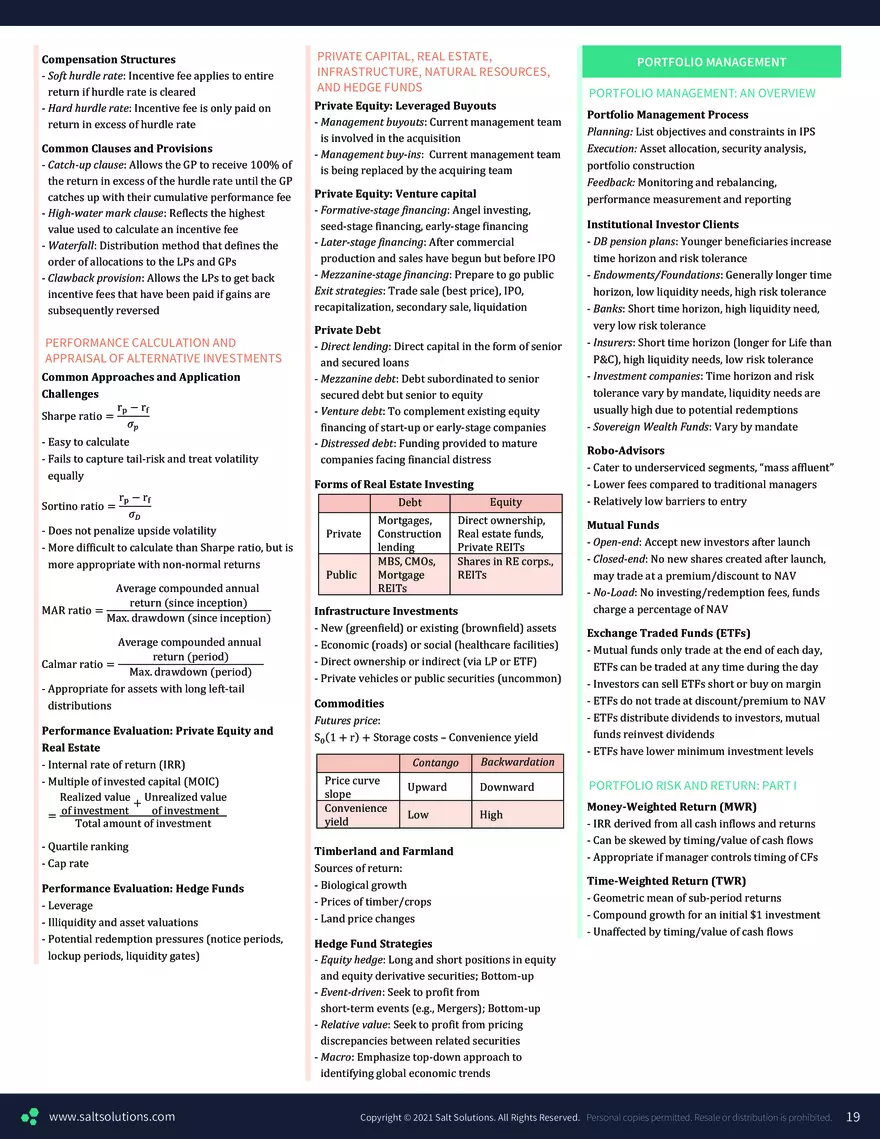
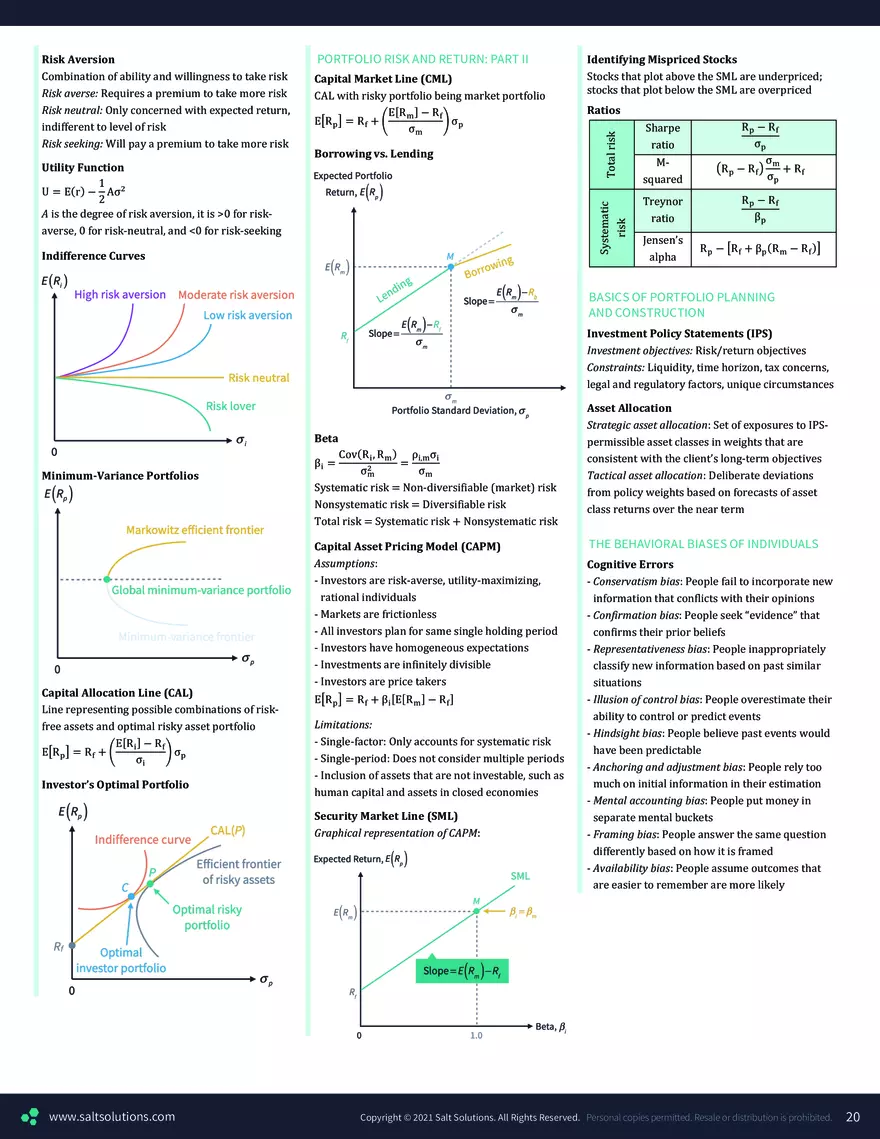


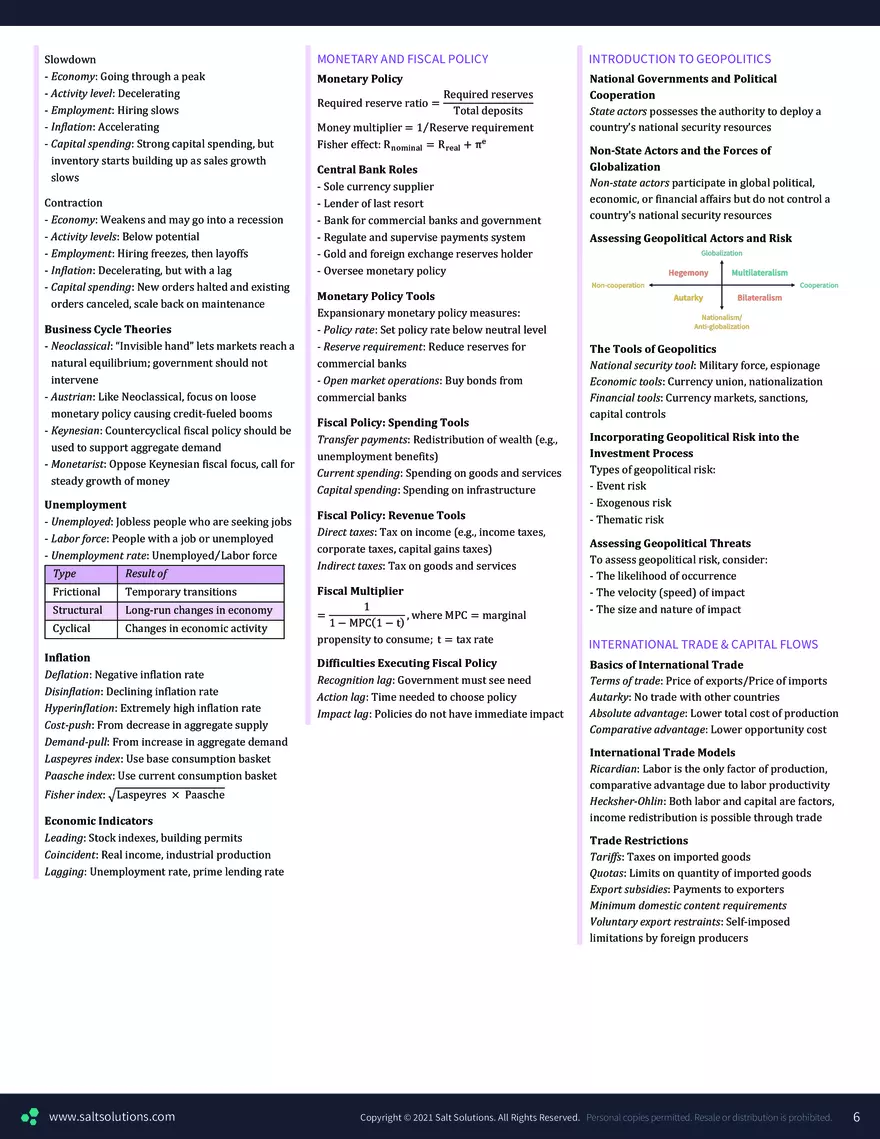
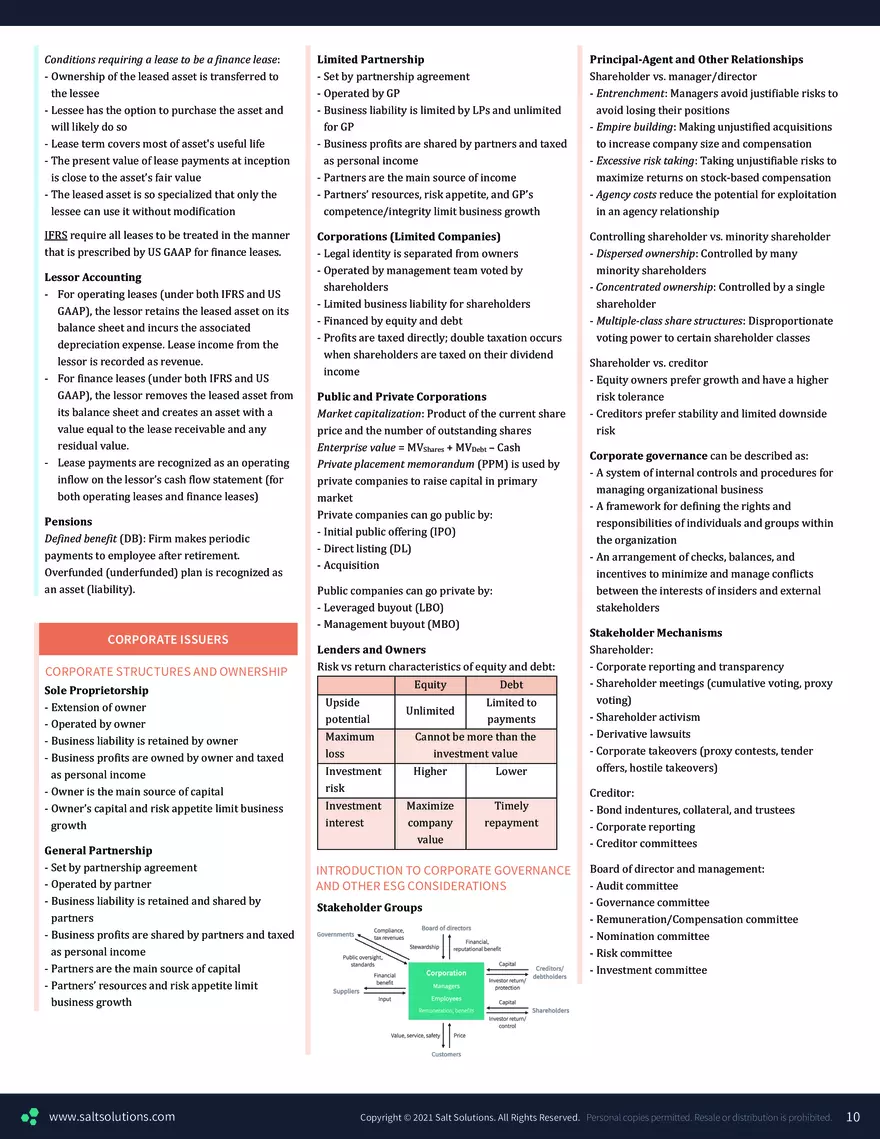
Report
Tell us what’s wrong with it:
Thanks, got it!
We will moderate it soon!
Report
Tell us what’s wrong with it:
Free up your schedule!
Our EduBirdie Experts Are Here for You 24/7! Just fill out a form and let us know how we can assist you.
Take 5 seconds to unlock
Enter your email below and get instant access to your document