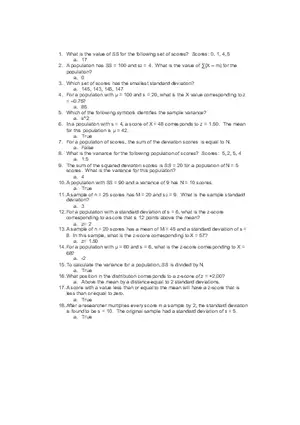
Lecture Note
Statistical Concepts and Practice Problems
-
University:
The University Of Western Ontario -
Course:
SS 2037B | Statistical Concepts Academic year:
2024
-
Views:
163
Pages:
2
Author:
Kyuwon J.
Related Documents
- Hypothesis Testing - Study Guide Part 2
- Essentials of Statistics for Business and Economics, Part 2
- Value of Information
- Sampling and Confidence Interval
- Essentials of Statistics for Business and Economics, Part 1
- Continuous Random Variables and Probability Distributions
- Chapter 10 Correlation and Regression
- Chapter 1 - Data and Statistics
- Math 130 Homework 7 Solutions
- Summary of Exponential Smoothing Lecture
- Statistical Thinking Applications
- Math 17, Section 2 Homework 8 Solutions
- Lab 3 for Math 17 Normality, Standardization, and Capture-Recapture
- Decomposing Variance Part2
- Decomposing Variance Part1
- Statistics Project: Exploring Global Economic Indicator
- Probability of Flight Delays Due to Weather Conditions
- Statistics Project. Analyzing the Impact of Smoking on Life Expectancy
- Chapter 7: Distribution of Sample Means
- Point Estimates and Confidence Intervals
Report
Tell us what’s wrong with it:
Thanks, got it!
We will moderate it soon!
Report
Tell us what’s wrong with it:
Free up your schedule!
Our EduBirdie Experts Are Here for You 24/7! Just fill out a form and let us know how we can assist you.
Take 5 seconds to unlock
Enter your email below and get instant access to your document


