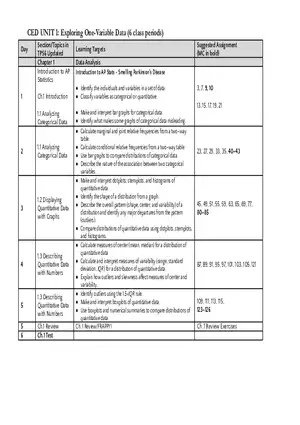
Lecture Note
Measures of Spread
-
University:
Winston-Salem Forsyth County Schools -
Course:
AP Statistics Academic year:
2014
-
Views:
74
Pages:
1
Author:
Rylee Roach
Related Documents
- Multiple Choice Review Answers
- Research Methods Review
- Statistics and Probability Sample Questions and Answers
- Collecting Statistical Data
- Statistics Review - Answers
- A Holistic Statistical Test for Fairness in Video Poker - Report
- Math 130 Section 01 – Introduction to Statistics - Final Exam
- Solutions to Supplementary Check
- Math 340, Guiz 2, Solutions
Report
Tell us what’s wrong with it:
Thanks, got it!
We will moderate it soon!
Report
Tell us what’s wrong with it:
Free up your schedule!
Our EduBirdie Experts Are Here for You 24/7! Just fill out a form and let us know how we can assist you.
Take 5 seconds to unlock
Enter your email below and get instant access to your document


