Ch 12 us 5
Name
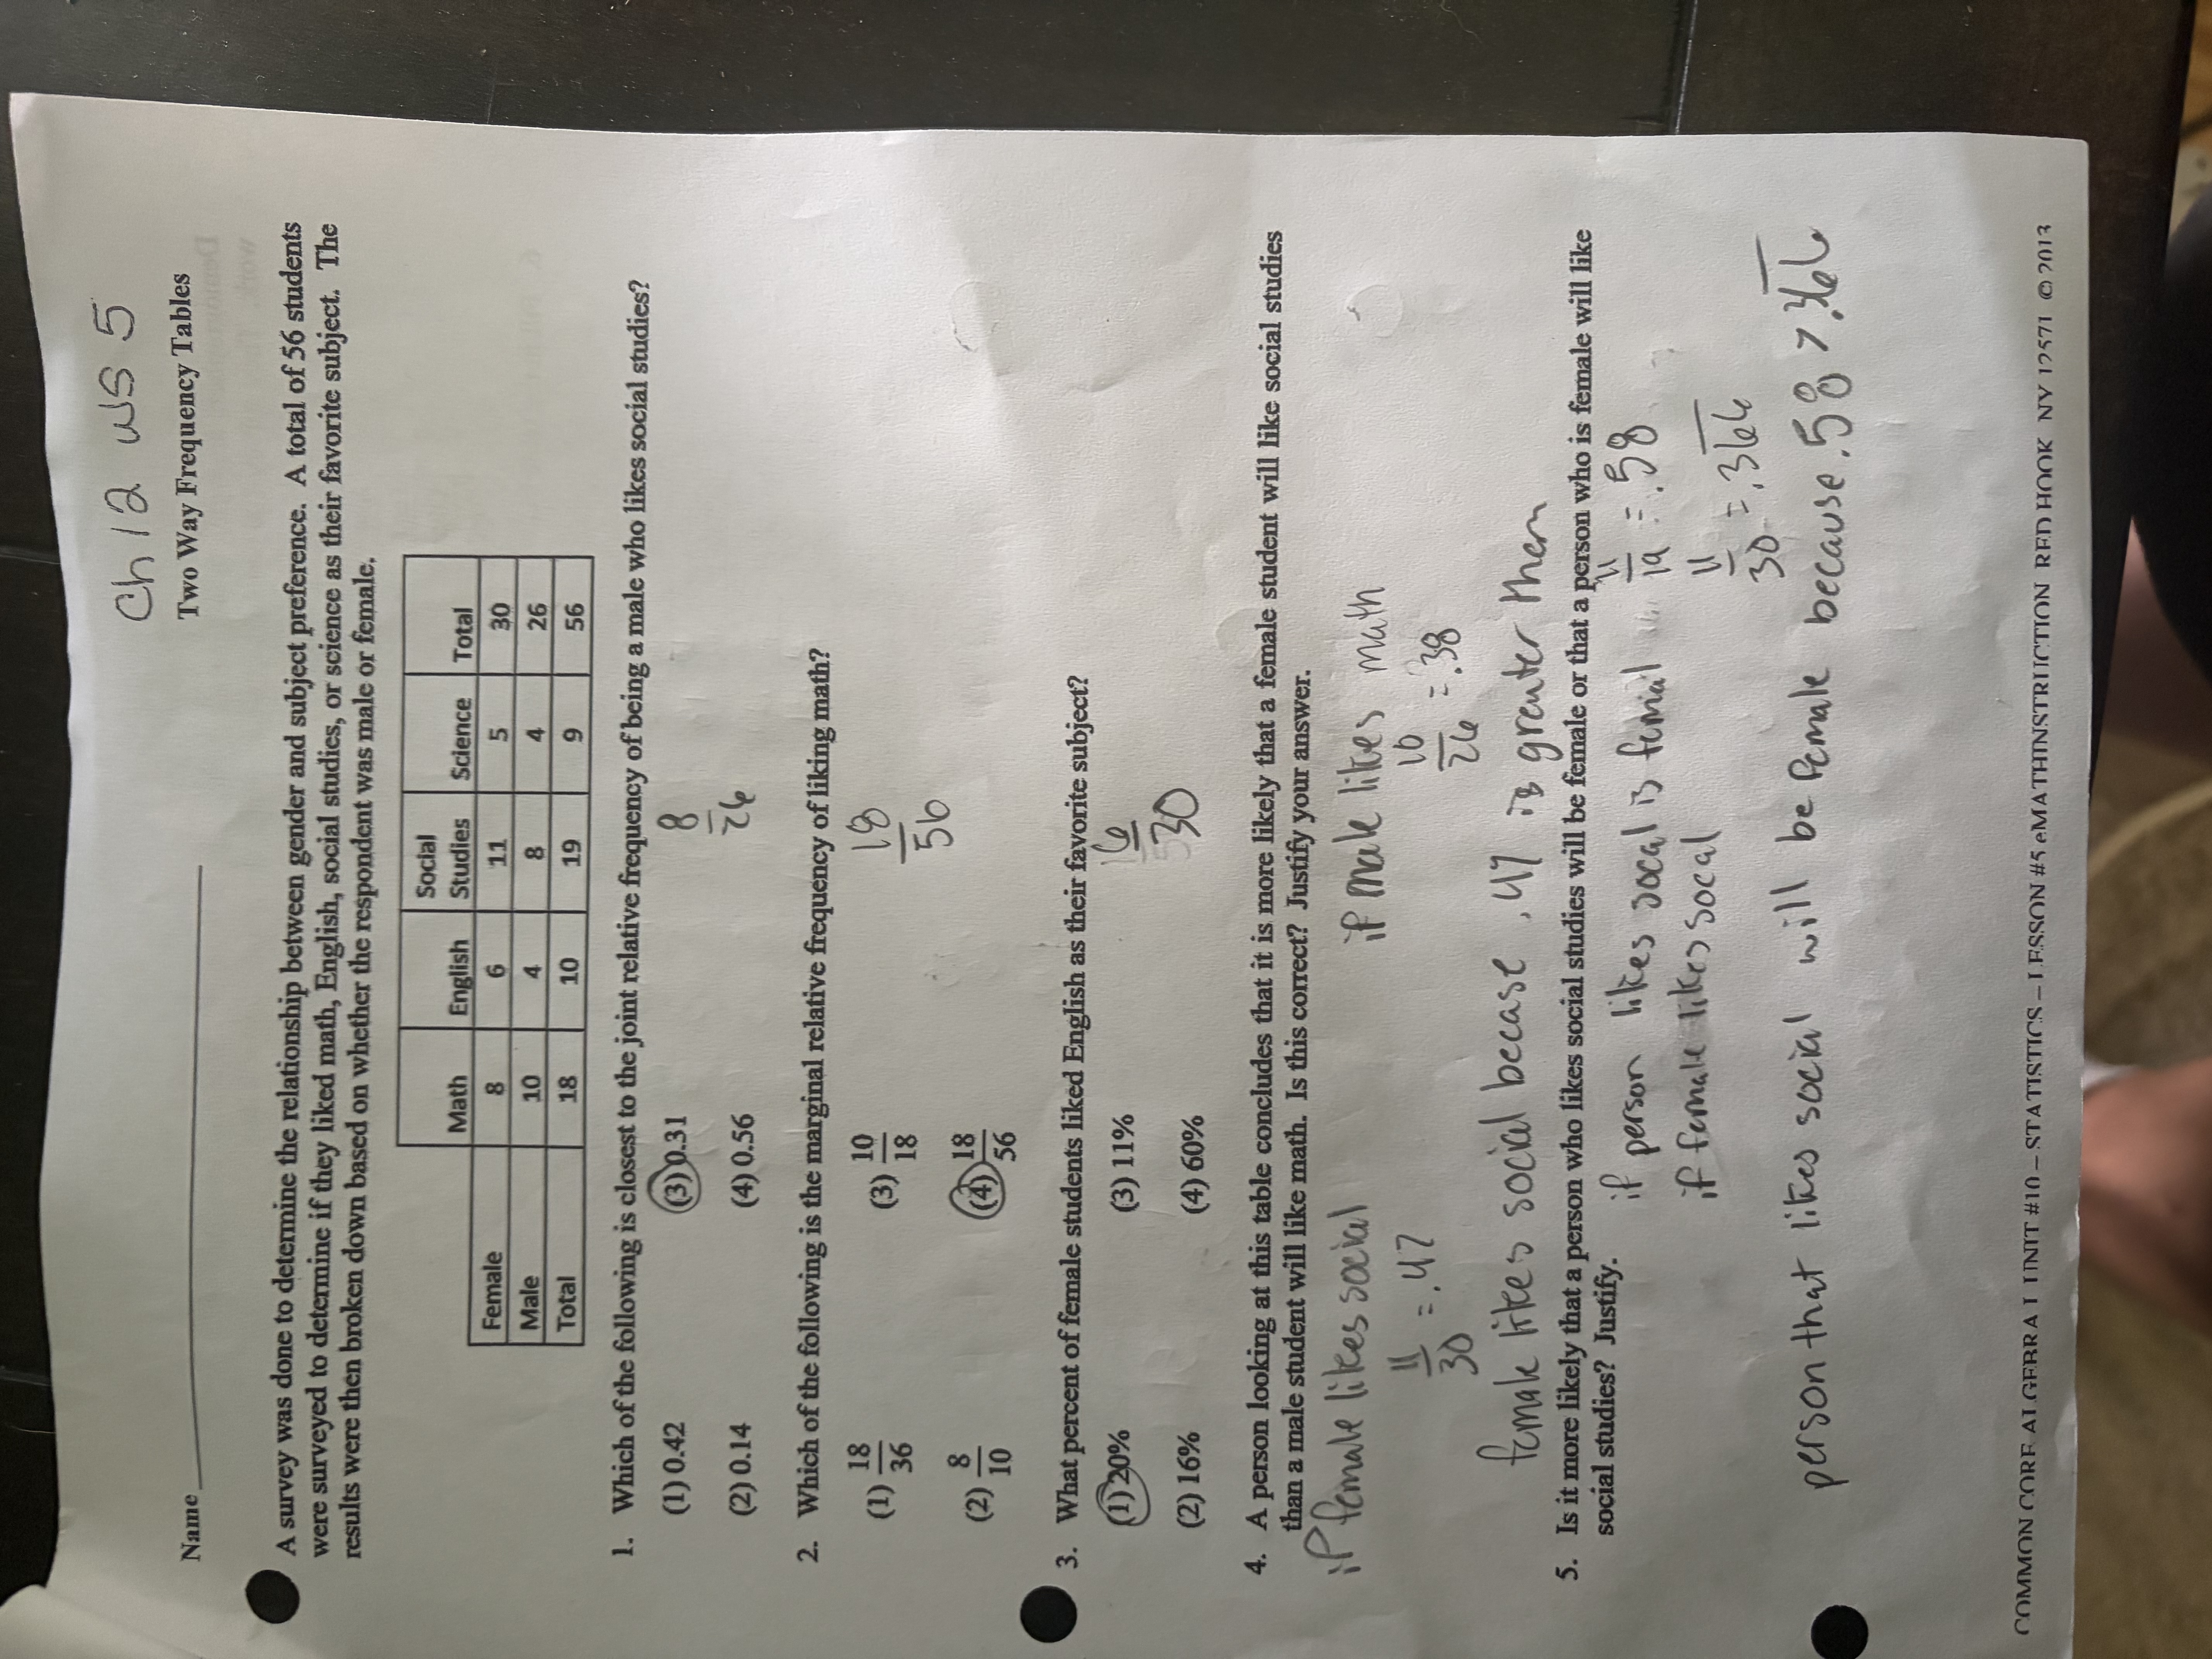
Two Way Frequency Tables
A survey was done to determine the relationship between gender and subject preference. A total of 56 students
were surveyed to determine if they liked math, English, social studies, or science as their favorite subject. The
results were then broken down based on whether the respondent was male or female.
Social
Math
English
Studies
Science
Total
Female
8
6
11
5
30
Male
10
4
8
4
26
Total
18
10
19
9
56
1. Which of the following is closest to the joint relative frequency of being a male who likes social studies?
(1) 0.42
(3) 0.31
8
(2) 0.14
(4) 0.56
26
2. Which of the following is the marginal relative frequency of liking math?
18
10
(1)
(3)
18
36
18
56
8
18
(2)
(4)
10
56
3. What percent of female students liked English as their favorite subject?
(1) 20%
(3) 11%
6
(2) 16%
(4) 60%
30
4. A person looking at this table concludes that it is more likely that a female student will like social studies
than a male student will like math. Is this correct? Justify your answer.
iP female likes social
if male likes math
=47
30
26 10 =.38
female likes social becase 47 is grenter them
5. Is it more likely that a person who likes social studies will be female or that a person who is female will like
social studies? Justify.
if person likes socal is femal
11 58
if female likes Socal
30.366 11
person that lites social will be female because . .58 7.66
COMMON CORE AI GEBR A T UNIT #10 - STATISTICS - I ESSON #5 eMATHINSTRUCTION RED HOOK NY 12571 © 2013


![1.0 Factoring - Worksheet 2 [Questions + Answers]](https://q2a.s3.us-west-1.amazonaws.com/prod/study_note/preview/1708335410-7415.webp)


