Hypothesis testing helps researchers decide whether results reflect a real effect or are due to random chance. Today, EduBirdie will tell you everything you need to know about hypothesis tests and how they can help you in the academic environment.
If you have any questions about academic tasks, hit EduBirdie with the message do my essay and we will make sure you get an A+ for your work!
What is Hypothesis Testing?
So, what is hypothesis testing?
It is a statistical method used to test whether an assumption about the data is likely to be true.
It is done by collecting sample data, running statistical tests, and deciding whether there is enough evidence to support a claim.
For example, a company may test if a new landing page increases conversions. Hypothesis testing determines whether the observed results occurred because of the new design or by random chance.
Why Does Hypothesis Testing Matter?
Hypothesis testing, or significance testing, is mostly used by businesses to improve products. Researchers also use it to analyze data, and students use it in academic projects and experiments. It is important because it doesn’t just rely on ideas or opinions. Such testing uses sample data and statistical analysis to check if results are statistically significant.
This statistical method is also important in academic writing and research projects. You may want to know what is hypothesis testing when considering the difference between dissertation vs thesis. Indeed, it may make a difference in the structure of your research and data interpretation!
Key Concepts of Hypothesis Testing
Before you run a hypothesis test, you need to understand a few basic terms. These concepts explain how statistical tests work and how researchers draw meaningful conclusions from data.
Null Hypothesis (H0).
The null hypothesis is the default assumption in testing. It states that there is no significant difference between groups or variables. With that, researchers try to determine whether there is sufficient evidence to reject H0.
A new landing page does not increase conversions.
A new teaching method does not improve student scores.
Alternative Hypothesis (H1 or Ha).
The alternative hypothesis is the opposite of the null hypothesis. It suggests that a real difference or relationship exists.
The new landing page increases conversions.
The new teaching method improves student scores.
The goal of statistical hypothesis testing is to decide which of these two hypotheses is better supported by data.
Significance Level (alpha).
Many students ask, “What is significance level in hypothesis testing?” The significance level, also called alpha, shows the probability of accepting a wrong conclusion. In most statistical tests, researchers use:
0.05 significance level.
5% probability of error.
A smaller significance level means stronger evidence is needed before researchers reject the null hypothesis.
P-Value Explained.
The p-value indicates how probable the observed results are due to random chance. There is one simple rule to remember:
Smaller p-value = stronger evidence against the null hypothesis.
Larger p-value = weaker evidence.
If the p-value is smaller than the significance level, the results are usually considered statistically significant.
Test Statistics.
The test statistic is a number calculated from sample data during data analysis. Different statistical tests use different test statistics:
Z test.
T-test.
Chi-square test.
ANOVA.
Statistical Significance.
Statistical significance means the observed difference is unlikely to occur by chance alone.
However, statistically significant results do not always mean the difference is practically important. Researchers should always consider real-world impact alongside statistical significance.
Confidence Level and Confidence Intervals.
A confidence level shows how confident researchers are in their results. Most studies use a 95% confidence level.
Confidence intervals indicate the range within which the true population parameter may fall. Narrow intervals usually suggest more reliable results.
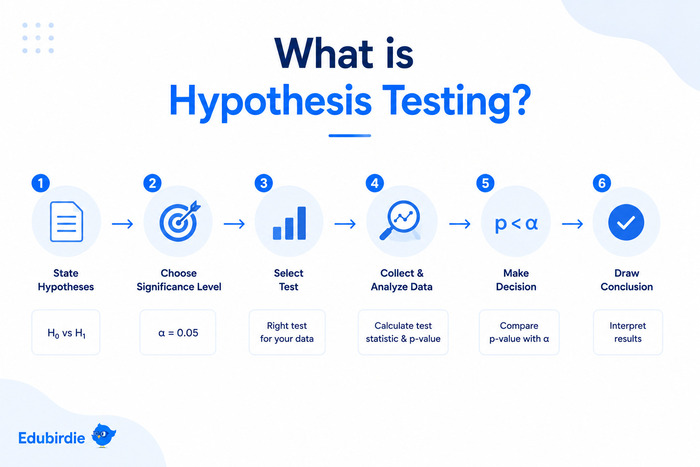
How to Test a Hypothesis in 6 Steps?
Now you know all the theoretical aspects of hypothesis testing. But the real question is: “What is the process of testing a hypothesis?” Some good news: it always follows the same logic.
A clear sequence starts with an assumption, uses data, and then makes a decision based on evidence.
1️⃣ State the Hypotheses
At the start of every test, you define two ideas: the null hypothesis (H0) or the alternative hypothesis (H1 or Ha). The H0 assumes no difference or effect. The H1 (Ha) says there is a difference. For instance:
H0: A new teaching method does not improve student scores.
H1: A new teaching method improves student scores.
This step closes the question “What is the purpose of hypothesis testing?” When it’s done, you go into the data.
2️⃣ Choose a Significance Level
Now you decide what is the significance level in hypothesis testing, so the risk you are willing to accept for a wrong conclusion. Most studies use 0.05 (5% risk).
This means you accept a small chance of a Type I error. It happens when you reject a true null hypothesis. A lower alpha means stronger evidence is needed to move forward.
3️⃣ Select the Appropriate Statistical Test
Next, you choose the right statistical test based on your data. A simple guide:
Situation
Test
Compare two means
t test
Large sample size
z test
Compare categories
chi-square test
Compare 3+ groups
ANOVA
You should also check:
sample size.
data type.
assumptions.
This step ensures your results are reliable.
4️⃣ Collect and Analyze Data
Now you collect sample data and run the test. You must calculate:
Test statistics.
P-value.
Standard error.
What is a test statistic in hypothesis testing? It shows how far your data is from the null prediction. The p-value indicates the probability that your results could be due to random chance.
5️⃣ Make a Decision
Now you can compare the results with the significance level. In hypothesis testing, what is the level of significance? It is the cutoff point that helps you decide whether to:
Reject the null hypothesis.
Fail to reject the null hypothesis.
Rules:
If p-value ≤ alpha → reject H0.
If p-value> alpha → fail to reject H0.
This step is the core of decision-making in statistical significance testing.
6️⃣ Interpret the Results
Finally, you explain what the results mean in real life. You do not just say “significant” or “ not significant.” Then, you explain the impact.
Tip: to explain the results, you can pose a question: Does the new method really improve performance? Is the difference practical or just statistical? What is the rejection region in hypothesis testing?
6 Types of Hypothesis Testing
Various statistical tests are used in hypothesis testing. Choosing the right test depends on your research question, what is level of significance in hypothesis testing, what is p-value in hypothesis testing, and the data type.
Z-Test.
T-Test.
Chi-Square Test.
ANOVA (analysis of variance).
Regression Testing.
Paired T-Test.
To make it easier, we’ve created a table that explains each type in simple terms. Anytime you need to refresh the type info, check it, and go back to your testing!
Test Type
Best Used For
Data Type
Example Use Case
Z-Test
Comparing means with large sample sizes
Numerical
Testing average app usage time
T-Test
Comparing means with small samples
Numerical
Comparing student exam scores
Chi-Square Test
Analyzing relationships between categories
Categorical
Gender vs product preference
ANOVA
Comparing 3+ group means
Numerical
Comparing sales across regions
Paired T-Test
Before-and-after comparisons
Numerical
Weight loss before and after a diet
Regression Testing
Measuring relationships between variables
Numerical
Ad spend vs revenue growth
Errors
Even when researchers follow the right steps, hypothesis testing in statistics can still lead to mistakes. That is why it is important to understand the most common errors before making data-driven decisions. The two main mistakes are:
What is a type 1 error in hypothesis testing (false positive)?
What is a type 2 error in hypothesis testing (false negative)?
Both errors affect the quality of your analysis and may lead to incorrect conclusions. Let’s talk more about them.
What is Type 1 Error in Hypothesis Testing (False Positive)?
A Type I error or false positive happens when researchers reject the null prediction even though it is indeed true. In simple words, the test shows there is an effect or difference when there is none.
This type of testing error is more common when researchers use a high significance level. A simple way to remember it:
Type I error = false alarm.
You reject the null hypothesis by mistake.
What is Type 2 Error in Hypothesis Testing (False Negative)?
A Type II error or false negative happens when researchers fail to reject the null hypothesis even though the alternative one is true.
Type II errors often happen when:
The sample size is too small.
The effect is weak.
Researchers collect limited data.
The test assumptions are not met.
In this case, you remember it like that:
Type II error = missed effect.
The test misses a real difference.
What is a Statistical Power Mistake?
This error measures how likely a test is to detect a real effect. In other words, power helps researchers determine if a study can find statistically meaningful results when they truly exist.
Several factors affect power:
sample size;
significance level;
variability in the data;
effect size.
Undeniably, high statistical power is important because it reduces the chance of Type II errors. Larger sample sizes usually increase statistical power because researchers have more evidence to work with. That is why collecting data from a sufficient number of participants is important for statistical inference and decision-making.
Real Business Case Example
Now, let’s look at a simple example of hypothesis testing that helps businesses make smarter, data-driven choices. This example can be applied both in professional and academic settings.
Problem Statement
A company wants to know if a new landing page increases sign-ups for its product. The marketing team believes the updated design will improve conversions.
The company collects sample data from two versions of the page:
old landing page.
new landing page.
The goal is to determine if the difference is statistically meaningful or just random probability.
Step-by-Step Solution
The test begins with two hypotheses.
Null hypothesis (H0): The new landing page does not increase conversions.
Alternative hypothesis (H1): The new landing page increases conversions.
Choose the statistical test.
The company compares conversion rates between two groups. Because the data involves sample means from two independent groups, researchers choose a t-test.
Tip: If the company had data from three or more groups, ANOVA would be a better choice.
Collect and analyze data.
After collecting data for two weeks, the results show:
Old landing page conversion rate: 8%.
New landing page conversion rate: 11%.
Researchers run the statistical test and calculate the p-value.
➡️ So, what is the p-value in hypothesis testing here? The p-value measures the probability of observing these results if the null hypothesis is true. A smaller p-value means stronger evidence against the null hypothesis.
In this example:
P-value = 0.03.
Significance level = 0.05.
Because the p-value is smaller than 0.05, the test shows statistically significant results.
Final Interpretation
The company now has sufficient evidence to reject the null hypothesis. The analysis suggests the new landing page will possibly improve conversions.
However, good decision-making also considers practical significance. Even though the increase is statistically significant, the business must still decide whether the improvement is large enough to justify the redesign costs.
6 Quick Tips for Best Practices
One last important thing we need to mention is that good hypothesis testing is not just about running statistical tests.
When you understand what is hypothesis testing in statistics, these best practices will help you avoid mistakes and draw meaningful conclusions even faster.
Best Practice
Why It Matters
1. Define hypotheses clearly
Clear null and alternative hypotheses reduce confusion during analysis.
2. Choose the correct test
The appropriate test depends on data type, sample size, and research goals.
3. Use adequate sample sizes
Larger samples usually provide stronger evidence and more reliable results.
4. Validate test assumptions
Checking assumptions helps avoid incorrect conclusions and weak test results.
5. Report confidence intervals
Confidence intervals show the expected range of the population parameter.
6. Explain the practical significance
Statistical significance should also have real-world value and practical impact.
A Few Final Words on Hypothesis Testing: Its Purpose and Importance
To sum up, hypothesis testing helps you use sample data, probability, and analysis to make clear decisions. Instead of guessing, you rely on evidence, which is really important for researchers, businesses, and even students.
Hypothesis testing supports better decision-making, stronger analysis, and more reliable evidence-based conclusions in real-world and academic work.
Now, we are confident that you know everything you need about hypothesis testing. But in case you need any additional help, EduBirdie is always here to work on your academic tasks together!
FAQ
What is hypothesis testing in simple terms?
Hypothesis testing is a statistical method used to determine if sample data support a specific assumption or claim.
What are the 5 steps of hypothesis testing?
State hypotheses, choose a significance level, select a test, analyze data, and draw meaningful conclusions from test results.
What is the difference between null and alternative hypotheses?
The null hypothesis assumes no difference. The alternative hypothesis suggests a statistically significant difference exists.
Is hypothesis testing used in machine learning?
Yes. It helps evaluate models, compare algorithms, and make data-driven decisions using statistical significance.
An academic writing specialist focused on citation accuracy and academic integrity. Contributing to EduBirdie since 2019, she helps students meet academic standards through structured writing, proper referencing, and ethical source use. Vast experience in English, History, Ethics.
Need essay writing service assistance?
EduBirdie’s experts are ready to help whenever you need support.
Double Meaning of Words: What are They? You can for sure name a word that has two meanings. Such words are called double entendre — words or phrases that have…
To successfully complete academic courses, graduate students must know how to write their academic papers with proper formatting. One way to do this is by understanding various citation styles, like…
Working on an academic paper can quickly become overwhelming when you’re faced with a massive amount of data and information to sift through. When kicking off a project, one of…